TECHNICAL ASSET FINGERPRINT
ec5ad3201012f7460fc8fd44
Click to view fullscreen
Press ESC or click to close
FOUND IN PAPERS
EXPERT: healer-alpha-free VERSION 1
RUNTIME: free/openrouter/healer-alpha
INTEL_VERIFIED
## [Line Charts]: Performance Comparison of Sorting Algorithms (WMS, BMS, RB-Sort)
### Overview
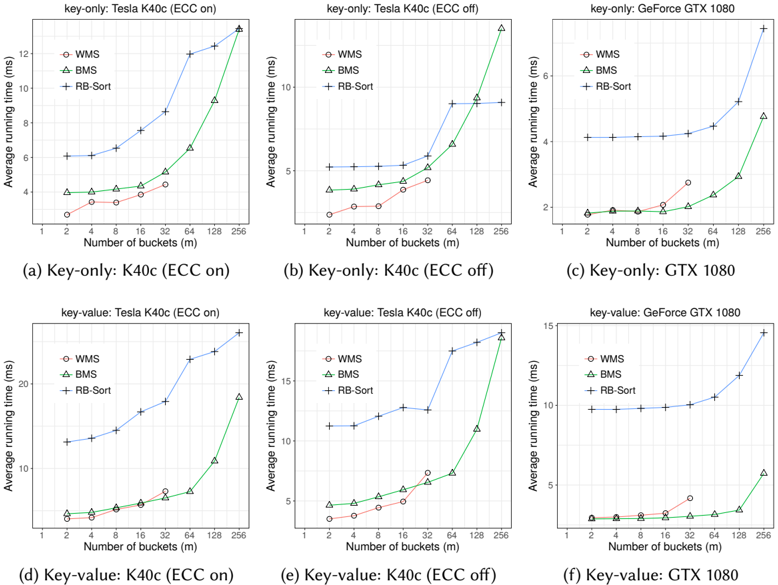
The image contains six line charts arranged in a 2x3 grid. They compare the average running time (in milliseconds) of three sorting algorithms—WMS, BMS, and RB-Sort—as a function of the number of buckets (m). The comparison is performed across two data types ("key-only" and "key-value") and three hardware/configurations: Tesla K40c with ECC on, Tesla K40c with ECC off, and GeForce GTX 1080.
### Components/Axes
* **Chart Layout:** Six subplots labeled (a) through (f).
* **X-Axis (All Charts):** "Number of buckets (m)". The scale is logarithmic, with major tick marks at 1, 2, 4, 8, 16, 32, 64, 128, and 256.
* **Y-Axis (All Charts):** "Average running time (ms)". The scale is linear but varies in range per chart.
* **Legend (All Charts):** Located in the top-left corner of each subplot.
* `WMS`: Red line with circle markers.
* `BMS`: Green line with triangle markers.
* `RB-Sort`: Blue line with plus sign markers.
* **Subplot Titles:**
* (a) `key-only: Tesla K40c (ECC on)`
* (b) `key-only: Tesla K40c (ECC off)`
* (c) `key-only: GeForce GTX 1080`
* (d) `key-value: Tesla K40c (ECC on)`
* (e) `key-value: Tesla K40c (ECC off)`
* (f) `key-value: GeForce GTX 1080`
### Detailed Analysis
**Trend Verification & Data Point Extraction (Approximate Values):**
**Top Row: Key-Only Data**
* **Chart (a) K40c (ECC on):**
* **RB-Sort (Blue +):** Starts at ~6 ms (m=1), increases steadily to ~13 ms (m=256). Trend: Consistently highest running time, steep upward slope.
* **BMS (Green △):** Starts at ~4 ms (m=1), remains flat until m=16, then increases sharply to ~13 ms (m=256). Trend: Flat then steep rise, converges with RB-Sort at m=256.
* **WMS (Red ○):** Starts at ~3 ms (m=1), increases gradually to ~4.5 ms (m=32). Data series ends at m=32. Trend: Lowest running time, gentle upward slope.
* **Chart (b) K40c (ECC off):**
* **RB-Sort (Blue +):** Starts at ~5 ms (m=1), increases to ~9 ms (m=256). Trend: Highest running time, moderate upward slope.
* **BMS (Green △):** Starts at ~4 ms (m=1), increases to ~13 ms (m=256). Trend: Steeper increase than RB-Sort, surpasses it at m=128.
* **WMS (Red ○):** Starts at ~2.5 ms (m=1), increases to ~4.5 ms (m=32). Data series ends at m=32. Trend: Lowest running time.
* **Chart (c) GTX 1080:**
* **RB-Sort (Blue +):** Starts at ~4 ms (m=1), increases to ~7 ms (m=256). Trend: Highest running time, moderate upward slope.
* **BMS (Green △):** Starts at ~1.8 ms (m=1), remains flat until m=64, then increases to ~5 ms (m=256). Trend: Flat then sharp rise.
* **WMS (Red ○):** Starts at ~1.8 ms (m=1), increases to ~3 ms (m=32). Data series ends at m=32. Trend: Similar to BMS initially, then lower.
**Bottom Row: Key-Value Data**
* **Chart (d) K40c (ECC on):**
* **RB-Sort (Blue +):** Starts at ~12 ms (m=1), increases steeply to ~25 ms (m=256). Trend: Highest running time, very steep upward slope.
* **BMS (Green △):** Starts at ~3 ms (m=1), increases to ~18 ms (m=256). Trend: Steep increase, remains below RB-Sort.
* **WMS (Red ○):** Starts at ~3 ms (m=1), increases to ~6 ms (m=64). Data series ends at m=64. Trend: Lowest running time.
* **Chart (e) K40c (ECC off):**
* **RB-Sort (Blue +):** Starts at ~11 ms (m=1), increases to ~18 ms (m=256). Trend: Highest running time.
* **BMS (Green △):** Starts at ~4 ms (m=1), increases to ~18 ms (m=256). Trend: Steep increase, converges with RB-Sort at m=256.
* **WMS (Red ○):** Starts at ~3 ms (m=1), increases to ~7 ms (m=64). Data series ends at m=64. Trend: Lowest running time.
* **Chart (f) GTX 1080:**
* **RB-Sort (Blue +):** Starts at ~9 ms (m=1), increases to ~14 ms (m=256). Trend: Highest running time.
* **BMS (Green △):** Starts at ~2.5 ms (m=1), remains flat until m=128, then increases to ~6 ms (m=256). Trend: Very flat until a late, sharp rise.
* **WMS (Red ○):** Starts at ~2.5 ms (m=1), increases to ~4.5 ms (m=64). Data series ends at m=64. Trend: Lowest running time.
### Key Observations
1. **Algorithm Hierarchy:** Across all configurations, RB-Sort consistently has the highest average running time. WMS consistently has the lowest, followed by BMS.
2. **Scalability:** The running time for all algorithms increases with the number of buckets (m). The rate of increase (slope) is generally steepest for RB-Sort and BMS at higher `m` values, especially for key-value data.
3. **Data Type Impact:** Running times are significantly higher for "key-value" data compared to "key-only" data for the same hardware and algorithm (e.g., compare (a) vs (d)).
4. **Hardware Impact:** The GeForce GTX 1080 generally shows lower running times than the Tesla K40c for the same data type and algorithm (e.g., compare (a) vs (c)).
5. **ECC Impact:** Disabling ECC on the Tesla K40c reduces running times for all algorithms (compare (a) vs (b), (d) vs (e)).
6. **WMS Data Limit:** The WMS algorithm's data series terminates earlier (at m=32 or m=64) than BMS and RB-Sort (which go to m=256) in all charts.
### Interpretation
This set of charts provides a performance benchmark for three sorting algorithms under varying conditions. The data suggests that **RB-Sort is the least efficient** of the three in terms of running time, while **WMS is the most efficient**. However, the early termination of the WMS data series might indicate a limitation in its scalability or applicability for a large number of buckets.
The **key-value operation is more computationally expensive** than the key-only operation, as expected. The **impact of hardware is clear**, with the consumer-grade GTX 1080 outperforming the professional-grade K40c in these specific tests. Furthermore, **enabling ECC memory on the K40c introduces a measurable performance overhead**, which is a known trade-off for increased reliability.
The most notable trend is the **divergent scalability** of the algorithms. BMS and RB-Sort show a non-linear, accelerating increase in running time as `m` grows, particularly for key-value data. In contrast, WMS shows a more linear and gentle increase, though its limited data range prevents a full comparison at high `m`. This suggests WMS may have a better algorithmic complexity class for this specific task, but its practical upper limit on `m` needs investigation. The charts effectively demonstrate the performance trade-offs between algorithm choice, data complexity, hardware selection, and system configuration (ECC).
DECODING INTELLIGENCE...