## Line Charts: GPU Performance Comparison Across Bucket Counts
### Overview
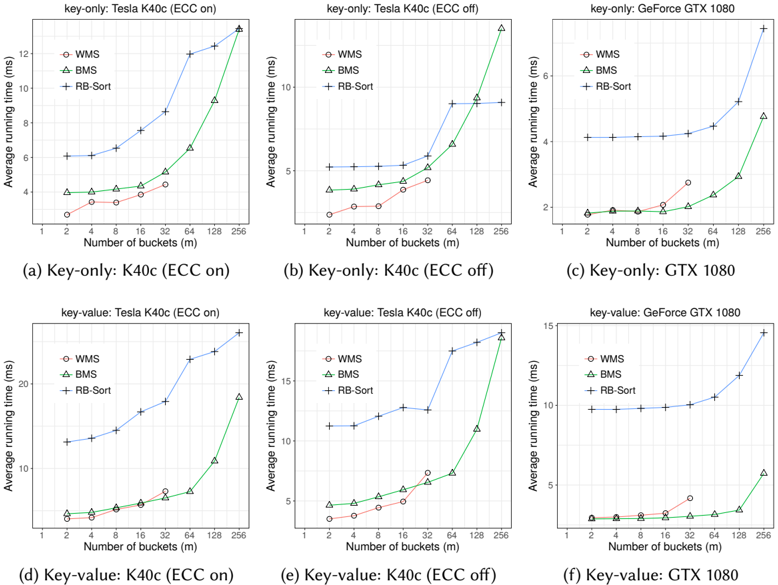
The image contains six line charts comparing the average running time (ms) of three sorting algorithms (WMS, BMS, RB-Sort) across different GPU models (Tesla K40c, GeForce GTX 1080) and ECC configurations (on/off). Each chart plots performance against the number of buckets (m), ranging from 1 to 256.
### Components/Axes
- **X-axis**: Number of buckets (m) - logarithmic scale (1, 2, 4, 8, 16, 32, 64, 128, 256)
- **Y-axis**: Average running time (ms) - linear scale (0-20 ms)
- **Legends**:
- Red circles (WMS)
- Green triangles (BMS)
- Blue crosses (RB-Sort)
- **Chart Labels**:
- Top row: Key-only operations
- Bottom row: Key-value operations
- GPU/ECC configurations:
- Tesla K40c with ECC on
- Tesla K40c with ECC off
- GeForce GTX 1080 with ECC on
- GeForce GTX 1080 with ECC off