## Line Chart with Geometric Shapes: Neural ODE Performance and Error Bounds
### Overview
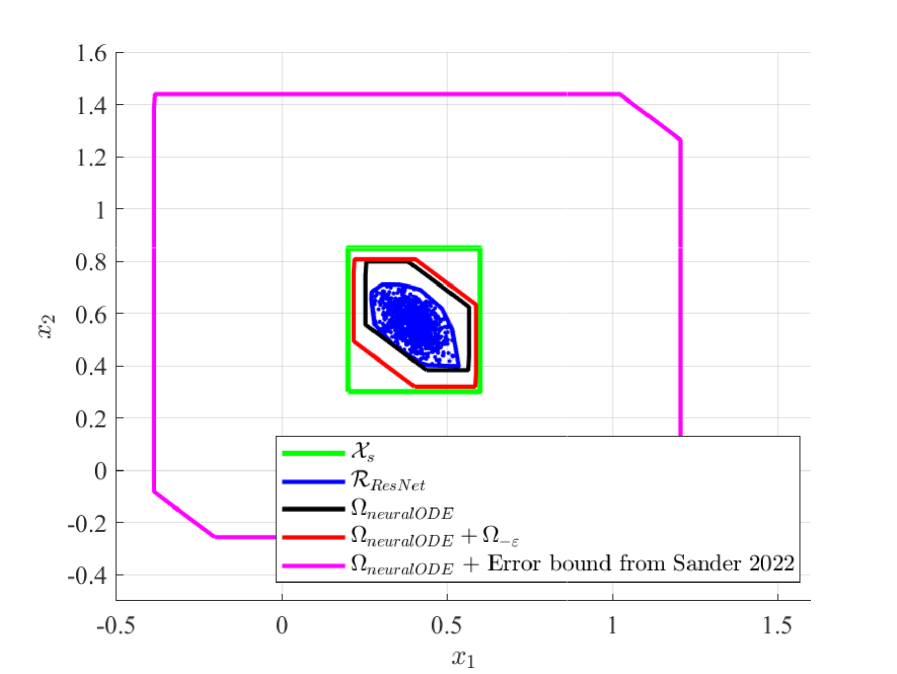
The image depicts a 2D line chart with geometric shapes overlaid, illustrating relationships between neural ordinary differential equations (ODEs), error bounds, and reference regions. The chart uses color-coded lines and polygons to represent mathematical sets and their spatial relationships.
### Components/Axes
- **Axes**:
- **x₁ (horizontal)**: Ranges from -0.5 to 1.5
- **x₂ (vertical)**: Ranges from -0.4 to 1.6
- **Legend**:
- **Green line (χₛ)**: Reference region
- **Blue filled area (R_ResNet)**: ResNet-related region
- **Black line (Ω_neuralODE)**: Base neural ODE region
- **Red line (Ω_neuralODE + Ω₋ε)**: Modified neural ODE region
- **Magenta line (Ω_neuralODE + Error bound)**: Error-bound-expanded region
### Detailed Analysis
1. **Magenta Line (Ω_neuralODE + Error bound)**:
- Forms a rectangular boundary with a notch on the left side.
- Coordinates:
- Starts at (-0.5, -0.4)
- Vertical segment to (-0.5, 1.6)
- Horizontal segment to (1.5, 1.6)
- Diagonal segment to (1.5, 0.8)
- Vertical segment to (1, 0.8)
- Horizontal segment to (-0.5, -0.4)
- **Trend**: Encloses all other elements, representing the maximum error-bound region.
2. **Green Line (χₛ)**:
- A smaller rectangle centered at (0.5, 0.5) with width 0.4 and height 0.4.
- Coordinates:
- Bottom-left: (0.3, 0.3)
- Top-right: (0.7, 0.7)
- **Trend**: Nested within the magenta boundary, likely a target or reference region.
3. **Blue Filled Area (R_ResNet)**:
- Irregular polygon within the green rectangle.
- Approximate coordinates:
- Left: (0.35, 0.35)
- Right: (0.65, 0.65)
- Top: (0.6, 0.7)
- Bottom: (0.4, 0.3)
- **Trend**: Overlaps with χₛ but is offset toward the upper-right corner.
4. **Black Line (Ω_neuralODE)**:
- Polygon within the blue area, centered at (0.5, 0.5).
- Approximate coordinates:
- Left: (0.45, 0.45)
- Right: (0.55, 0.55)
- Top: (0.5, 0.6)
- Bottom: (0.5, 0.4)
- **Trend**: Symmetric and compact, representing the base neural ODE performance.
5. **Red Line (Ω_neuralODE + Ω₋ε)**:
- Larger polygon than the black line, also centered at (0.5, 0.5).
- Approximate coordinates:
- Left: (0.4, 0.4)
- Right: (0.6, 0.6)
- Top: (0.55, 0.65)
- Bottom: (0.45, 0.35)
- **Trend**: Expands outward compared to the black line, indicating parameter modification effects.
### Key Observations
- The magenta line (error bound) dominates the chart, suggesting significant uncertainty in the neural ODE model.
- The green rectangle (χₛ) acts as a constrained reference, while the blue area (R_ResNet) shows ResNet's influence within this constraint.
- The black and red lines demonstrate how adding Ω₋ε to the neural ODE expands its operational region but remains within R_ResNet.
- The notch in the magenta line suggests a specific exclusion or adjustment in the error calculation.
### Interpretation
This visualization highlights the interplay between neural ODEs, ResNet integration, and error bounds. The nested regions imply hierarchical constraints:
1. **Error Bound Dominance**: The magenta line's size emphasizes the critical role of error tolerance in model reliability.
2. **ResNet Influence**: The blue area's offset within χₛ suggests ResNet modifies the target region's geometry.
3. **Parameter Sensitivity**: The red line's expansion relative to the black line indicates that Ω₋ε significantly alters the neural ODE's behavior, potentially improving or complicating performance depending on context.
4. **Geometric Relationships**: The precise alignment of shapes (e.g., red line centered within blue) implies deliberate mathematical relationships, possibly reflecting optimization criteria or stability conditions.
The chart underscores the importance of error bounds in neural ODE modeling and how parameter adjustments (like Ω₋ε) interact with reference regions and error tolerances.