## Line Chart: Model Performance Scores Across Various Math Benchmarks
### Overview
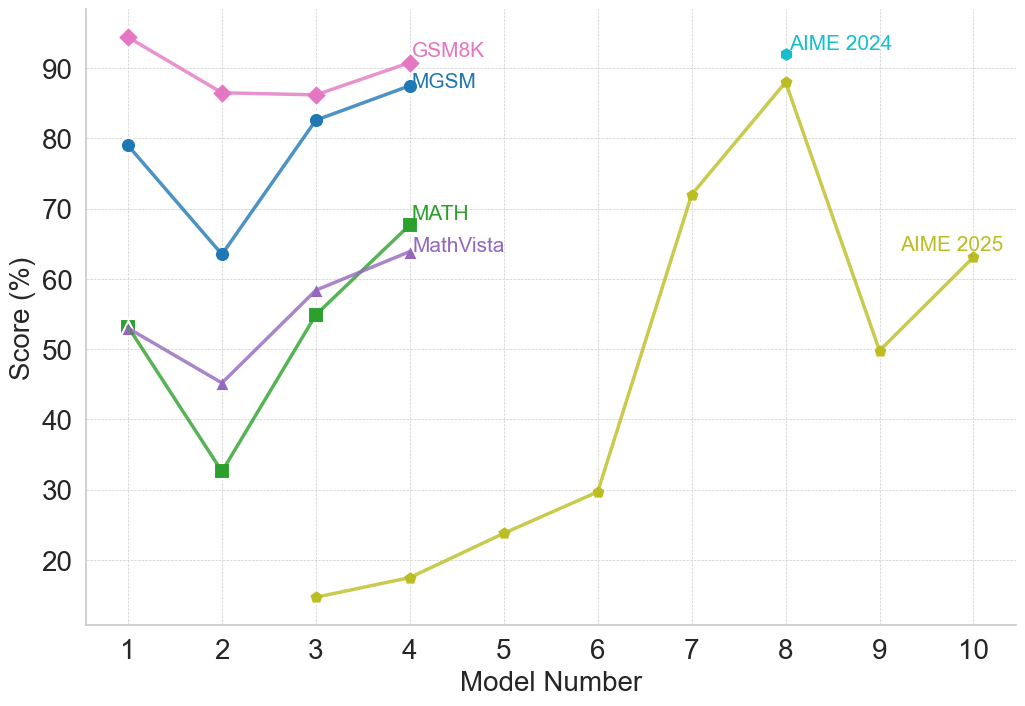
This image is a line chart displaying the performance scores (in percentages) of various numbered models across six different mathematical and reasoning benchmarks. The chart illustrates how performance changes across a sequence of models (labeled 1 through 10), with some benchmarks evaluated only on a subset of these models.
### Components/Axes
* **Y-axis (Vertical):**
* **Label:** "Score (%)"
* **Scale:** Ranges from below 20 to above 90.
* **Markers/Ticks:** Major gridlines and numeric labels are provided at intervals of 10 (20, 30, 40, 50, 60, 70, 80, 90).
* **X-axis (Horizontal):**
* **Label:** "Model Number"
* **Scale:** Discrete integer values from 1 to 10.
* **Markers/Ticks:** Major vertical gridlines and numeric labels are provided at every integer (1, 2, 3, 4, 5, 6, 7, 8, 9, 10).
* **Legend/Labels:** There is no separate legend box. Instead, data series are identified by inline text labels placed adjacent to the final data point of each respective line. The series are distinguished by line color and marker shape.
### Detailed Analysis
*Note: All numerical values extracted below are approximate based on visual interpolation between gridlines, with an estimated uncertainty of ±1.0%.*
**1. GSM8K (Pink line, Diamond markers)**
* *Spatial Grounding:* Located in the top-left quadrant. The label "GSM8K" is positioned to the right of the final data point at x=4.
* *Trend Verification:* The line starts at the highest overall value on the chart, dips moderately at Model 2, remains relatively flat at Model 3, and rises again at Model 4.
* *Data Points:*
* Model 1: ~94.5%
* Model 2: ~86.5%
* Model 3: ~86.0%
* Model 4: ~91.0%
**2. MGSM (Blue line, Circle markers)**
* *Spatial Grounding:* Located in the top-left quadrant, directly below the GSM8K line. The label "MGSM" is positioned to the right of the final data point at x=4.
* *Trend Verification:* The line starts high, experiences a sharp decline at Model 2, recovers sharply at Model 3, and continues to rise moderately at Model 4.
* *Data Points:*
* Model 1: ~79.0%
* Model 2: ~63.5%
* Model 3: ~82.5%
* Model 4: ~87.5%
**3. MATH (Green line, Square markers)**
* *Spatial Grounding:* Located in the middle-left area. The label "MATH" is positioned to the right of the final data point at x=4.
* *Trend Verification:* Starts in the middle range, drops significantly to a local minimum at Model 2, rebounds sharply at Model 3, and continues upward at Model 4.
* *Data Points:*
* Model 1: ~53.0%
* Model 2: ~32.5%
* Model 3: ~55.0%
* Model 4: ~67.5%
**4. MathVista (Purple line, Triangle markers)**
* *Spatial Grounding:* Located in the middle-left area, intersecting the MATH line. The label "MathVista" is positioned to the right of the final data point at x=4.
* *Trend Verification:* Shares the exact starting point with MATH, dips moderately at Model 2, rises steadily through Models 3 and 4.
* *Data Points:*
* Model 1: ~53.0% (Overlaps with MATH)
* Model 2: ~45.0%
* Model 3: ~58.5%
* Model 4: ~64.0%
**5. AIME 2024 (Cyan point, Hexagon marker)**
* *Spatial Grounding:* Located in the top-right quadrant. It is a single, isolated data point. The label "AIME 2024" is positioned to the right of the point.
* *Trend Verification:* N/A (Single point).
* *Data Point:*
* Model 8: ~92.0%
**6. AIME 2025 (Olive/Yellow-green line, Pentagon markers)**
* *Spatial Grounding:* Spans from the bottom-left (starting at x=3) across to the middle-right. The label "AIME 2025" is positioned above the final data point at x=10.
* *Trend Verification:* Starts at the lowest point on the chart at Model 3. It rises slowly through Model 6, then spikes dramatically at Model 7 and peaks at Model 8. It then suffers a severe drop at Model 9 before recovering moderately at Model 10.
* *Data Points:*
* Model 3: ~14.5%
* Model 4: ~17.5%
* Model 5: ~23.5%
* Model 6: ~29.5%
* Model 7: ~72.0%
* Model 8: ~88.0%
* Model 9: ~49.5%
* Model 10: ~63.0%
### Key Observations
1. **The "Model 2 Dip":** Every benchmark evaluated on Models 1 through 4 (GSM8K, MGSM, MATH, MathVista) exhibits a distinct performance drop from Model 1 to Model 2, followed by a recovery in subsequent models.
2. **Incomplete Series:** Models 1 through 4 are evaluated on four specific benchmarks. Models 5 through 10 are *only* evaluated on the AIME 2025 benchmark (with the exception of the single AIME 2024 point at Model 8).
3. **Model 8 Peak:** Model 8 represents a massive peak in performance for the AIME 2025 benchmark (~88%), and is also the only model evaluated on AIME 2024, scoring exceptionally high (~92%).
4. **Benchmark Difficulty:** Based on the scores for Models 3 and 4, AIME 2025 is significantly more difficult than the other benchmarks, scoring roughly 40-70 percentage points lower than GSM8K, MGSM, MATH, and MathVista on those specific models.
### Interpretation
This chart likely represents the evaluation of a family of AI models (perhaps different sizes, iterations, or training checkpoints of a specific foundation model series) against standard mathematical reasoning benchmarks.
* **Reading between the lines regarding Model 2:** The universal dip at Model 2 suggests that this specific model is either a smaller parameter version (e.g., a 7B model compared to a 70B Model 1), a base model prior to instruction tuning, or a flawed checkpoint.
* **Shift in Evaluation Strategy:** The abrupt stop of GSM8K, MGSM, MATH, and MathVista at Model 4, combined with the introduction of AIME 2025 at Model 3, suggests a shift in the researchers' focus. It is highly probable that Models 5-10 became so capable that the earlier benchmarks (like GSM8K) "saturated" (approached 100%), prompting the evaluators to switch exclusively to a much harder benchmark (AIME 2025) to accurately measure further improvements.
* **The Significance of Model 8:** Model 8 is a major outlier in capability. The fact that it was specifically chosen to be tested against AIME 2024, and that it peaked on AIME 2025, implies Model 8 might be a specialized "Math" variant of the model family, or the largest/most heavily trained version. The subsequent drop at Model 9 suggests Model 9 might be a return to a smaller or more generalized model architecture before improving again at Model 10.