## Line Chart: Model Performance Comparison
### Overview
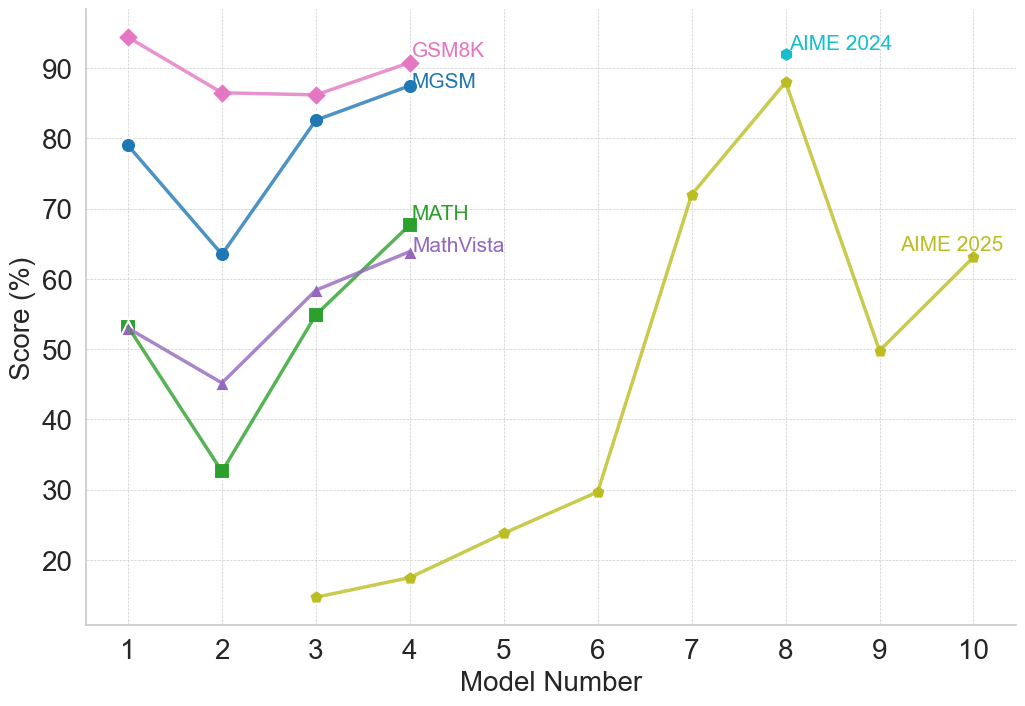
The image is a line chart comparing the performance of different models on various tasks. The chart plots the "Score (%)" on the y-axis against the "Model Number" on the x-axis. There are five data series, each representing a different task: GSM8K, MGSM, MATH, MathVista, AIME 2024, and AIME 2025.
### Components/Axes
* **X-axis:** "Model Number" ranging from 1 to 10.
* **Y-axis:** "Score (%)" ranging from 20 to 90, with gridlines at intervals of 10.
* **Legend:** Located in the top-right area of the chart, associating colors and markers with task names.
* GSM8K: Pink line with diamond markers.
* MGSM: Blue line with circle markers.
* MATH: Green line with square markers.
* MathVista: Purple line with triangle markers.
* AIME 2024: Teal line with circle markers.
* AIME 2025: Yellow-green line with circle markers.
### Detailed Analysis
* **GSM8K (Pink, Diamond):** Starts at approximately 94% for Model 1, decreases to about 87% for Model 2, remains relatively stable at approximately 87% for Model 3, and increases slightly to approximately 91% for Model 4.
* **MGSM (Blue, Circle):** Starts at approximately 79% for Model 1, decreases to about 63% for Model 2, increases to approximately 83% for Model 3, and increases slightly to approximately 87% for Model 4.
* **MATH (Green, Square):** Starts at approximately 53% for Model 1, decreases to about 33% for Model 2, increases to approximately 55% for Model 3, and increases to approximately 68% for Model 4.
* **MathVista (Purple, Triangle):** Starts at approximately 53% for Model 1, decreases to about 45% for Model 2, increases to approximately 58% for Model 3, and increases to approximately 65% for Model 4.
* **AIME 2024 (Teal, Circle):** Only data point is at Model 8, with a score of approximately 93%.
* **AIME 2025 (Yellow-Green, Circle):** Starts at approximately 15% for Model 3, increases to approximately 18% for Model 4, increases to approximately 24% for Model 5, increases to approximately 30% for Model 6, increases to approximately 72% for Model 7, increases to approximately 88% for Model 8, decreases to approximately 50% for Model 9, and increases to approximately 63% for Model 10.
### Key Observations
* GSM8K and MGSM generally outperform MATH and MathVista across the first four models.
* AIME 2024 has a single data point at Model 8, indicating it might be specifically designed or evaluated for that model.
* AIME 2025 shows a significant performance increase from Model 3 to Model 8, followed by a decrease and then a slight increase.
### Interpretation
The chart provides a comparative analysis of different models' performance on various tasks. The tasks GSM8K and MGSM appear to be easier or better suited for the initial models (1-4) compared to MATH and MathVista. The AIME 2024 task seems to be specifically targeted towards Model 8. The AIME 2025 task shows a more complex performance pattern, suggesting that the models' suitability for this task varies significantly. The data suggests that different models excel at different tasks, and the choice of model should be tailored to the specific task at hand. The AIME 2025 data suggests that model number 8 is particularly good at this task, but model 9 is particularly bad.