# Technical Document Analysis: Line Chart
## 1. Chart Overview
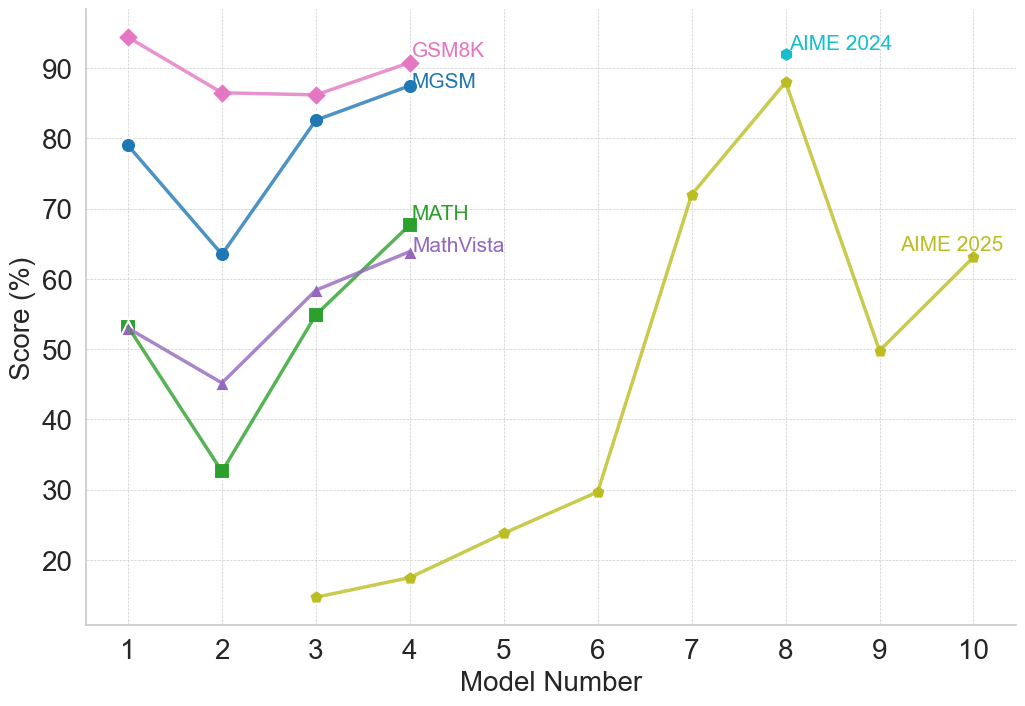
The image depicts a **line chart** comparing performance scores of five AI models across 10 model numbers. The chart uses distinct colors for each data series, with a legend positioned at the **top-right corner**.
---
## 2. Axis Labels and Scale
- **X-axis**:
- Title: `Model Number`
- Range: 1 to 10 (integer increments)
- **Y-axis**:
- Title: `Score (%)`
- Range: 0 to 100 (integer increments)
---
## 3. Legend and Data Series
The legend identifies five data series with corresponding colors:
1. **GSM8K** (pink)
2. **MGSM** (blue)
3. **MATH** (green)
4. **MathVista** (purple)
5. **AIME 2025** (yellow)
**Note**: A cyan data point labeled `AIME 2024` (score: 92) appears at Model 8 but is **not included in the legend**.
---
## 4. Data Points and Trends
### GSM8K (Pink)
- **Trend**: Starts high (95 at Model 1), dips slightly (87 at Model 2), then rises to 90 at Model 4.
- **Scores**:
- Model 1: 95
- Model 2: 87
- Model 3: 86
- Model 4: 90
### MGSM (Blue)
- **Trend**: Sharp decline (80 → 65), followed by recovery (83 → 88).
- **Scores**:
- Model 1: 80
- Model 2: 65
- Model 3: 83
- Model 4: 88
### MATH (Green)
- **Trend**: Initial drop (53 → 33), then steady increase (55 → 68).
- **Scores**:
- Model 1: 53
- Model 2: 33
- Model 3: 55
- Model 4: 68
### MathVista (Purple)
- **Trend**: Mild decline (53 → 45), followed by gradual rise (58 → 65).
- **Scores**:
- Model 1: 53
- Model 2: 45
- Model 3: 58
- Model 4: 65
### AIME 2025 (Yellow)
- **Trend**: Starts low (15 at Model 3), sharp rise (18 → 30), peaks at 90 (Model 8), then declines (50 at Model 9) before recovering (63 at Model 10).
- **Scores**:
- Model 3: 15
- Model 4: 18
- Model 5: 25
- Model 6: 30
- Model 7: 72
- Model 8: 90
- Model 9: 50
- Model 10: 63
### AIME 2024 (Cyan)
- **Single Data Point**:
- Model 8: 92
---
## 5. Spatial Grounding
- **Legend Position**: Top-right corner (outside the main chart area).
- **Data Point Alignment**:
- All legend colors match their respective lines (e.g., pink = GSM8K).
- `AIME 2024` (cyan) is an outlier not tied to the legend.
---
## 6. Component Isolation
### Header
- No explicit header text; title inferred from context.
### Main Chart
- Five line series with varying trends.
- `AIME 2024` (cyan) is a standalone point at Model 8.
### Footer
- No footer elements present.
---
## 7. Data Table Reconstruction
| Model Number | GSM8K | MGSM | MATH | MathVista | AIME 2025 | AIME 2024 |
|--------------|-------|------|------|-----------|-----------|-----------|
| 1 | 95 | 80 | 53 | 53 | - | - |
| 2 | 87 | 65 | 33 | 45 | - | - |
| 3 | 86 | 83 | 55 | 58 | 15 | - |
| 4 | 90 | 88 | 68 | 65 | 18 | - |
| 5 | - | - | - | - | 25 | - |
| 6 | - | - | - | - | 30 | - |
| 7 | - | - | - | - | 72 | - |
| 8 | - | - | - | - | 90 | 92 |
| 9 | - | - | - | - | 50 | - |
| 10 | - | - | - | - | 63 | - |
---
## 8. Key Observations
1. **GSM8K** maintains the highest scores overall (86–95 range).
2. **AIME 2025** shows volatility, peaking at Model 8 (90) before dropping.
3. **MATH** and **MathVista** exhibit similar recovery patterns after initial dips.
4. **AIME 2024** (cyan) outperforms all models at Model 8 (92).
---
## 9. Language and Transcription
- **Primary Language**: English.
- **No Additional Languages Detected**.
---
## 10. Critical Notes
- The `AIME 2024` data point (cyan) is not explained in the legend.
- `AIME 2025` scores for Models 1–2 are missing.
- All trends align with the visual slopes of the lines.