## Line Charts: Error Analysis of Different Methods
### Overview
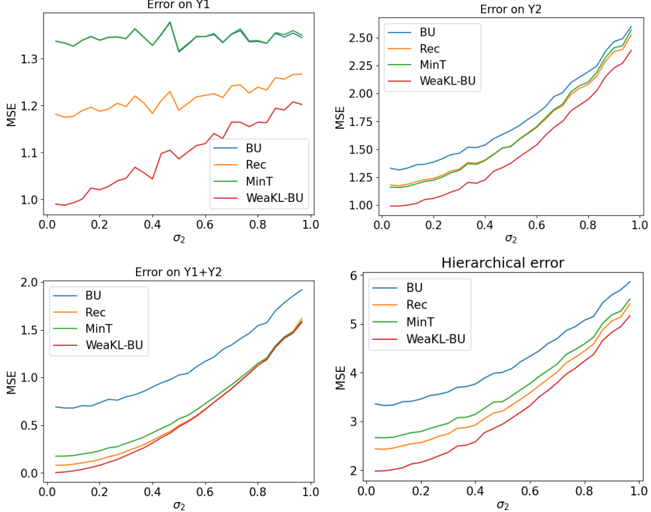
The image contains four line charts comparing the Mean Squared Error (MSE) of four different methods (BU, Rec, MinT, and WeaKL-BU) across varying values of σ2. The charts depict the error on Y1, Y2, Y1+Y2, and the hierarchical error.
### Components/Axes
* **X-axis (all charts):** σ2, ranging from 0.0 to 1.0 in increments of 0.2.
* **Y-axis (all charts):** MSE (Mean Squared Error). The range varies for each chart.
* **Legends (all charts, top-right):**
* Blue: BU
* Orange: Rec
* Green: MinT
* Red: WeaKL-BU
### Detailed Analysis
**1. Error on Y1 (Top-Left Chart):**
* Y-axis ranges from 1.0 to 1.3.
* **BU (Blue):** Relatively flat line, fluctuating slightly around MSE = 1.28 with a slight downward trend towards σ2 = 1.0.
* **Rec (Orange):** Relatively flat line, fluctuating slightly around MSE = 1.18 with a slight upward trend towards σ2 = 1.0.
* **MinT (Green):** Relatively flat line, fluctuating slightly around MSE = 1.34 with a slight downward trend towards σ2 = 1.0.
* **WeaKL-BU (Red):** Starts at MSE ≈ 0.98 at σ2 = 0.0 and increases to approximately MSE = 1.18 at σ2 = 1.0.
**2. Error on Y2 (Top-Right Chart):**
* Y-axis ranges from 1.0 to 2.5.
* **BU (Blue):** Starts at MSE ≈ 1.25 at σ2 = 0.0 and increases to approximately MSE = 2.5 at σ2 = 1.0.
* **Rec (Orange):** Starts at MSE ≈ 1.20 at σ2 = 0.0 and increases to approximately MSE = 2.25 at σ2 = 1.0.
* **MinT (Green):** Starts at MSE ≈ 1.30 at σ2 = 0.0 and increases to approximately MSE = 2.35 at σ2 = 1.0.
* **WeaKL-BU (Red):** Starts at MSE ≈ 1.10 at σ2 = 0.0 and increases to approximately MSE = 2.15 at σ2 = 1.0.
**3. Error on Y1+Y2 (Bottom-Left Chart):**
* Y-axis ranges from 0.0 to 2.0.
* **BU (Blue):** Starts at MSE ≈ 0.20 at σ2 = 0.0 and increases to approximately MSE = 1.95 at σ2 = 1.0.
* **Rec (Orange):** Starts at MSE ≈ 0.10 at σ2 = 0.0 and increases to approximately MSE = 1.60 at σ2 = 1.0.
* **MinT (Green):** Starts at MSE ≈ 0.10 at σ2 = 0.0 and increases to approximately MSE = 1.55 at σ2 = 1.0.
* **WeaKL-BU (Red):** Starts at MSE ≈ 0.00 at σ2 = 0.0 and increases to approximately MSE = 1.55 at σ2 = 1.0.
**4. Hierarchical Error (Bottom-Right Chart):**
* Y-axis ranges from 2.0 to 6.0.
* **BU (Blue):** Starts at MSE ≈ 2.25 at σ2 = 0.0 and increases to approximately MSE = 5.80 at σ2 = 1.0.
* **Rec (Orange):** Starts at MSE ≈ 2.00 at σ2 = 0.0 and increases to approximately MSE = 5.20 at σ2 = 1.0.
* **MinT (Green):** Starts at MSE ≈ 2.25 at σ2 = 0.0 and increases to approximately MSE = 5.30 at σ2 = 1.0.
* **WeaKL-BU (Red):** Starts at MSE ≈ 1.80 at σ2 = 0.0 and increases to approximately MSE = 5.10 at σ2 = 1.0.
### Key Observations
* In the "Error on Y1" chart, the errors for BU, Rec, and MinT are relatively stable across different values of σ2, while WeaKL-BU shows a clear increasing trend.
* In the "Error on Y2", "Error on Y1+Y2", and "Hierarchical error" charts, all methods show an increasing trend in MSE as σ2 increases.
* WeaKL-BU generally has the lowest error at σ2 = 0.0 in the "Error on Y2", "Error on Y1+Y2", and "Hierarchical error" charts.
### Interpretation
The charts illustrate how the performance of different forecasting methods (BU, Rec, MinT, and WeaKL-BU) changes with respect to the parameter σ2. The "Error on Y1" chart suggests that the error on Y1 is relatively stable for BU, Rec, and MinT, while WeaKL-BU's error increases with σ2. The other three charts ("Error on Y2", "Error on Y1+Y2", and "Hierarchical error") show that the error for all methods increases as σ2 increases, indicating that higher values of σ2 negatively impact the accuracy of the forecasts for Y2, the combined Y1+Y2, and the hierarchical structure. WeaKL-BU seems to perform better at lower values of σ2 in terms of initial error, but its performance degrades as σ2 increases, similar to the other methods. The choice of method and the value of σ2 should be carefully considered based on the specific forecasting goals and the relative importance of accuracy at different levels of the hierarchy.