## Line Graphs: Error Analysis Across Different Metrics
### Overview
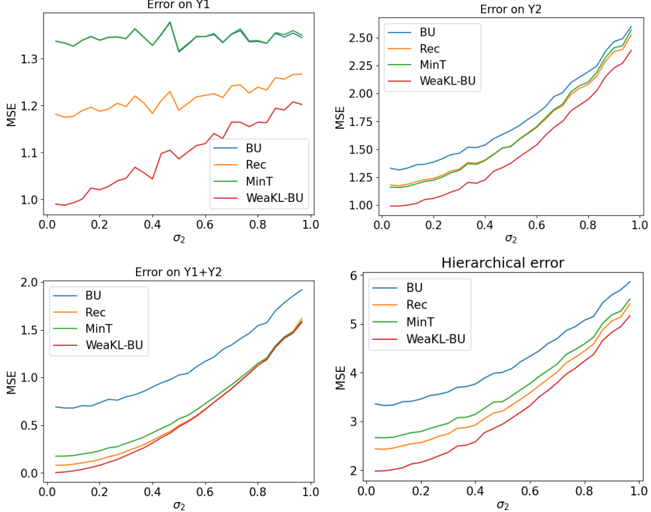
The image contains four line graphs arranged in a 2x2 grid, each depicting the Mean Squared Error (MSE) of different methods as a function of the parameter σ₂ (ranging from 0.0 to 1.0). The graphs are labeled as follows:
1. **Top-left**: Error on Y1
2. **Top-right**: Error on Y2
3. **Bottom-left**: Error on Y1+Y2
4. **Bottom-right**: Hierarchical error
Each graph includes a legend with four methods: BU (blue), Rec (orange), MinT (green), and WeaKL-BU (red). The y-axis is labeled "MSE" with approximate values ranging from 0.0 to 2.5 (top-left and top-right) and 0.0 to 6.0 (bottom-left and bottom-right).
---
### Components/Axes
- **X-axis**: σ₂ (0.0 to 1.0) in all subplots.
- **Y-axis**: MSE (Mean Squared Error) with varying ranges:
- Top-left (Y1): ~1.0 to 1.3
- Top-right (Y2): ~1.0 to 2.5
- Bottom-left (Y1+Y2): ~0.0 to 2.0
- Bottom-right (Hierarchical error): ~2.0 to 6.0
- **Legends**: Positioned in the top-right corner of each subplot, with colors:
- BU: Blue
- Rec: Orange
- MinT: Green
- WeaKL-BU: Red
---
### Detailed Analysis
#### Top-left: Error on Y1
- **BU (blue)**: Flat line at ~1.3 MSE.
- **Rec (orange)**: Slightly increasing trend, starting at ~1.2 and rising to ~1.3.
- **MinT (green)**: Decreasing trend, starting at ~1.3 and dropping to ~1.1.
- **WeaKL-BU (red)**: Increasing trend, starting at ~1.0 and rising to ~1.2.
#### Top-right: Error on Y2
- **BU (blue)**: Steeply increasing from ~1.2 to ~2.5.
- **Rec (orange)**: Gradual increase from ~1.2 to ~2.2.
- **MinT (green)**: Moderate increase from ~1.1 to ~2.0.
- **WeaKL-BU (red)**: Steep increase from ~1.0 to ~2.2.
#### Bottom-left: Error on Y1+Y2
- **BU (blue)**: Gradual increase from ~0.5 to ~1.5.
- **Rec (orange)**: Slight increase from ~0.2 to ~0.5.
- **MinT (green)**: Moderate increase from ~0.1 to ~0.4.
- **WeaKL-BU (red)**: Steep increase from ~0.0 to ~0.5.
#### Bottom-right: Hierarchical error
- **BU (blue)**: Steep increase from ~3.0 to ~6.0.
- **Rec (orange)**: Moderate increase from ~2.5 to ~5.0.
- **MinT (green)**: Gradual increase from ~2.0 to ~4.5.
- **WeaKL-BU (red)**: Steep increase from ~2.0 to ~5.5.
---
### Key Observations
1. **Consistency of Trends**:
- In all subplots, **WeaKL-BU (red)** and **MinT (green)** generally show lower MSE values compared to **BU (blue)** and **Rec (orange)**.
- **BU (blue)** consistently exhibits the highest MSE across all metrics, especially in the hierarchical error subplot.
2. **σ₂ Dependency**:
- As σ₂ increases, MSE values rise for all methods, but the rate of increase varies. For example:
- In the hierarchical error subplot, **BU (blue)** increases sharply, while **WeaKL-BU (red)** and **MinT (green)** show more gradual rises.
3. **Performance Differences**:
- **WeaKL-BU (red)** and **MinT (green)** outperform **BU (blue)** and **Rec (orange)** in most cases, particularly in the Y1+Y2 and hierarchical error subplots.
---
### Interpretation
The data suggests that **WeaKL-BU** and **MinT** are more robust to variations in σ₂ compared to **BU** and **Rec**, as evidenced by their lower MSE values across all metrics. The hierarchical error subplot highlights the sensitivity of **BU** to σ₂, with its MSE increasing dramatically as σ₂ approaches 1.0. This implies that **WeaKL-BU** and **MinT** may be better suited for scenarios with higher uncertainty (larger σ₂). The consistent underperformance of **BU** across all metrics raises questions about its stability or adaptability in dynamic environments.