## Line Chart: Trends in Credibility Assessment Research
### Overview
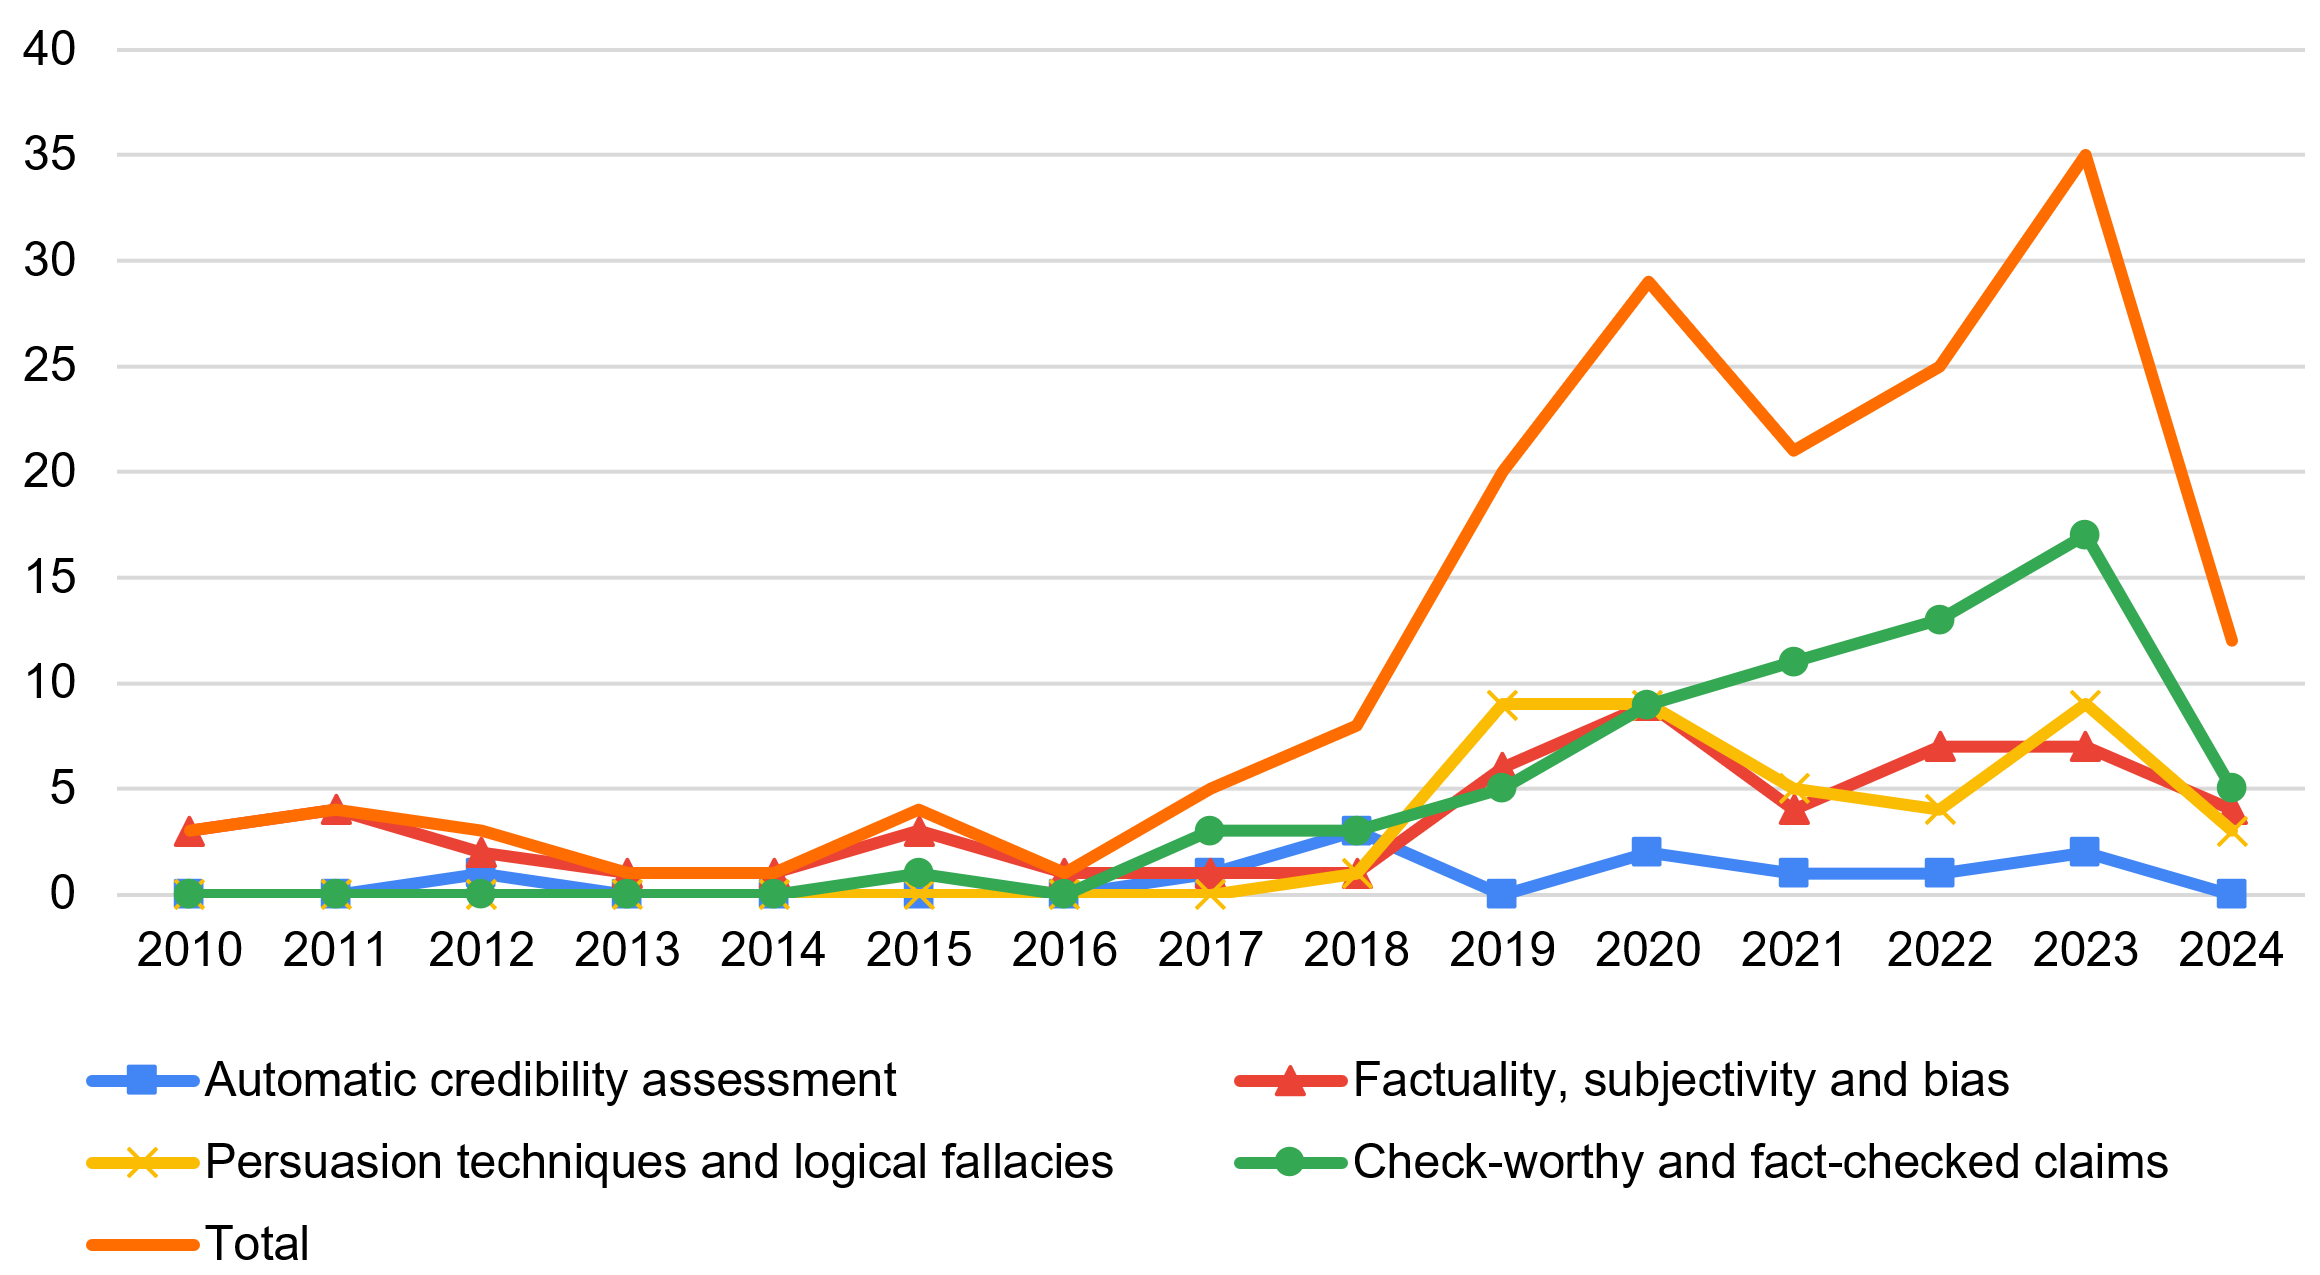
The image is a line chart illustrating the trends in research related to credibility assessment from 2010 to 2024. It shows the number of publications or studies in different categories over time. The categories include "Automatic credibility assessment," "Factuality, subjectivity and bias," "Persuasion techniques and logical fallacies," "Check-worthy and fact-checked claims," and "Total."
### Components/Axes
* **X-axis:** Years from 2010 to 2024.
* **Y-axis:** Numerical scale from 0 to 40, with increments of 5.
* **Legend:** Located at the bottom of the chart, mapping colors to categories:
* Blue: Automatic credibility assessment
* Red: Factuality, subjectivity and bias
* Yellow: Persuasion techniques and logical fallacies
* Green: Check-worthy and fact-checked claims
* Orange: Total
### Detailed Analysis
* **Automatic credibility assessment (Blue):**
* Trend: Relatively flat and low throughout the period.
* Approximate values:
* 2010: 0
* 2015: 0
* 2019: 2
* 2024: 2
* **Factuality, subjectivity and bias (Red):**
* Trend: Generally increasing, with some fluctuations.
* Approximate values:
* 2010: 3
* 2015: 3
* 2019: 7
* 2024: 4
* **Persuasion techniques and logical fallacies (Yellow):**
* Trend: Increasing until 2020, then decreasing.
* Approximate values:
* 2010: 0
* 2015: 0
* 2019: 9
* 2024: 3
* **Check-worthy and fact-checked claims (Green):**
* Trend: Increasing, peaking in 2023, then decreasing.
* Approximate values:
* 2010: 0
* 2015: 0
* 2019: 7
* 2024: 5
* **Total (Orange):**
* Trend: Significant increase, peaking in 2023, then decreasing.
* Approximate values:
* 2010: 3
* 2015: 3
* 2019: 13
* 2023: 35
* 2024: 12
### Key Observations
* The "Total" publications (orange line) show a significant increase over the years, peaking in 2023.
* "Check-worthy and fact-checked claims" (green line) and "Persuasion techniques and logical fallacies" (yellow line) also show notable increases, but with a decrease in 2024.
* "Automatic credibility assessment" (blue line) remains relatively low and stable.
* "Factuality, subjectivity and bias" (red line) shows a moderate increase.
### Interpretation
The chart indicates a growing interest and research activity in the field of credibility assessment, particularly in areas related to fact-checking and persuasion techniques. The peak in 2023 suggests a heightened focus on these topics, possibly driven by specific events or trends. The relatively low activity in "Automatic credibility assessment" might indicate that this area is either less explored or faces significant challenges. The overall increase in research suggests a growing awareness of the importance of credibility assessment in various domains.