## Line Chart: Misinformation Trends (2010-2024)
### Overview
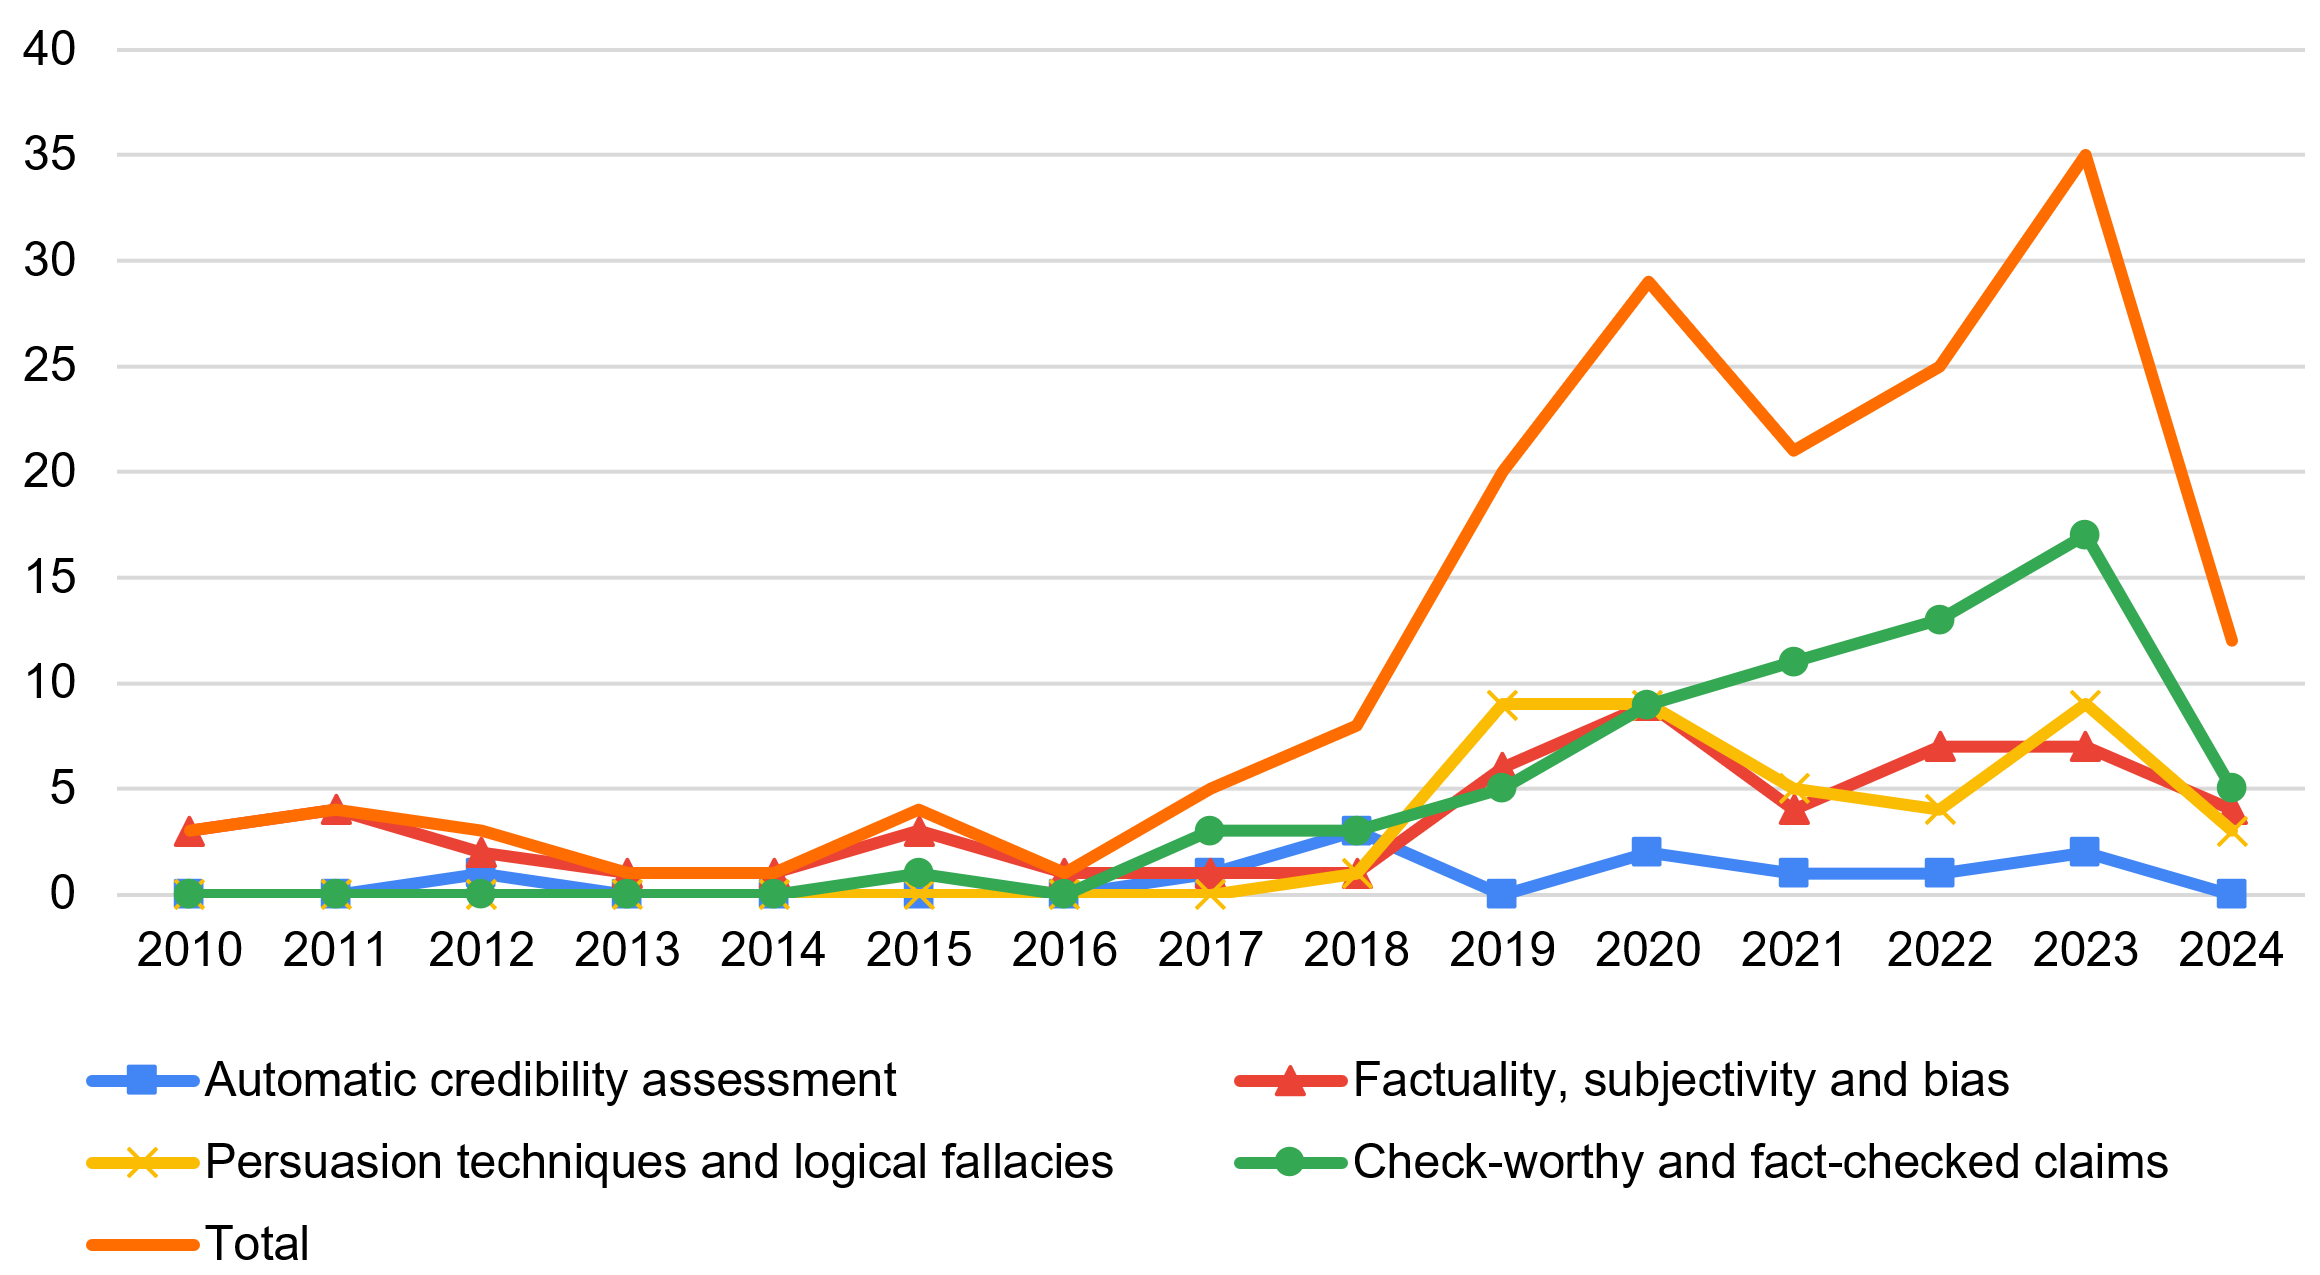
This line chart depicts the trends of different types of misinformation assessments from 2010 to 2024. The chart displays five data series: Automatic credibility assessment, Factuality, subjectivity and bias, Persuasion techniques and logical fallacies, Check-worthy and fact-checked claims, and Total. The Y-axis represents a numerical scale, presumably the number of instances or a related metric, while the X-axis represents the years from 2010 to 2024.
### Components/Axes
* **X-axis:** Years (2010, 2011, 2012, 2013, 2014, 2015, 2016, 2017, 2018, 2019, 2020, 2021, 2022, 2023, 2024)
* **Y-axis:** Scale from 0 to 40 (units not specified)
* **Data Series:**
* Automatic credibility assessment (Blue line with diamond markers)
* Factuality, subjectivity and bias (Red line with triangle markers)
* Persuasion techniques and logical fallacies (Yellow line with star markers)
* Check-worthy and fact-checked claims (Green line with circle markers)
* Total (Orange line with square markers)
* **Legend:** Located at the top-left of the chart, associating colors with each data series.
### Detailed Analysis
Here's a breakdown of each data series and their trends:
* **Total (Orange):** This line shows a generally increasing trend over the period. It starts at approximately 16 in 2010, fluctuates between 15 and 30 from 2011 to 2021, then experiences a sharp increase from 2022, reaching approximately 35 in 2024.
* **Automatic credibility assessment (Blue):** This line remains relatively flat throughout the period, fluctuating between 2 and 5. It shows a slight dip around 2017, reaching a minimum of approximately 1, and then recovers to around 3-4 by 2024.
* **Factuality, subjectivity and bias (Red):** This line shows a gradual increase from approximately 2 in 2010 to around 6 in 2019. It then experiences a more significant increase, reaching approximately 16 in 2023 and remaining around 15 in 2024.
* **Persuasion techniques and logical fallacies (Yellow):** This line is highly volatile. It starts at approximately 1 in 2010, increases to around 4 in 2014, dips to almost 0 in 2017, and then experiences a dramatic increase from 2019, peaking at approximately 30 in 2020, then decreasing to around 8 in 2024.
* **Check-worthy and fact-checked claims (Green):** This line shows a steady increase from approximately 1 in 2010 to around 17 in 2024. It exhibits a relatively consistent upward trend with minor fluctuations.
**Approximate Data Points (extracted from the chart):**
| Year | Total | Automatic Credibility | Factuality/Bias | Persuasion/Fallacies | Check-worthy/Fact-checked |
|---|---|---|---|---|---|
| 2010 | 16 | 3 | 2 | 1 | 1 |
| 2011 | 17 | 3 | 3 | 2 | 2 |
| 2012 | 16 | 3 | 3 | 2 | 3 |
| 2013 | 18 | 3 | 4 | 3 | 3 |
| 2014 | 20 | 4 | 4 | 4 | 4 |
| 2015 | 21 | 4 | 5 | 3 | 4 |
| 2016 | 20 | 4 | 5 | 3 | 5 |
| 2017 | 18 | 1 | 5 | 0 | 5 |
| 2018 | 22 | 2 | 6 | 2 | 6 |
| 2019 | 26 | 3 | 6 | 6 | 7 |
| 2020 | 30 | 3 | 8 | 30 | 8 |
| 2021 | 27 | 3 | 10 | 15 | 10 |
| 2022 | 32 | 3 | 13 | 12 | 13 |
| 2023 | 35 | 4 | 16 | 10 | 16 |
| 2024 | 35 | 4 | 15 | 8 | 17 |
### Key Observations
* The "Total" misinformation trend is significantly driven by the "Persuasion techniques and logical fallacies" category, especially after 2019.
* "Check-worthy and fact-checked claims" show a consistent increase, but are not enough to offset the growth in other categories.
* "Automatic credibility assessment" remains relatively stable, suggesting limited impact from automated tools during this period.
* The sharp increase in "Persuasion techniques and logical fallacies" in 2020 is a notable outlier.
### Interpretation
The data suggests a growing trend in misinformation from 2010 to 2024, with a particularly sharp increase in recent years. The rise in "Persuasion techniques and logical fallacies" indicates that manipulative content is becoming more prevalent. While efforts to identify and fact-check claims ("Check-worthy and fact-checked claims") are increasing, they are not keeping pace with the overall growth of misinformation. The relatively stable "Automatic credibility assessment" suggests that automated tools are not effectively addressing the problem.
The relationship between the data series is clear: the "Total" trend is a sum of the individual categories. The dramatic spike in "Persuasion techniques and logical fallacies" in 2020 could be linked to specific events (e.g., political campaigns, global events) that spurred the spread of manipulative content. The consistent increase in "Check-worthy and fact-checked claims" demonstrates a growing awareness and response to misinformation, but the data also highlights the need for more effective strategies to combat its spread. The chart implies that the types of misinformation are evolving, with a greater emphasis on persuasive techniques rather than simply factual inaccuracies.