## Line Chart: Research Publication Trends in Credibility and Fact-Checking (2010-2024)
### Overview
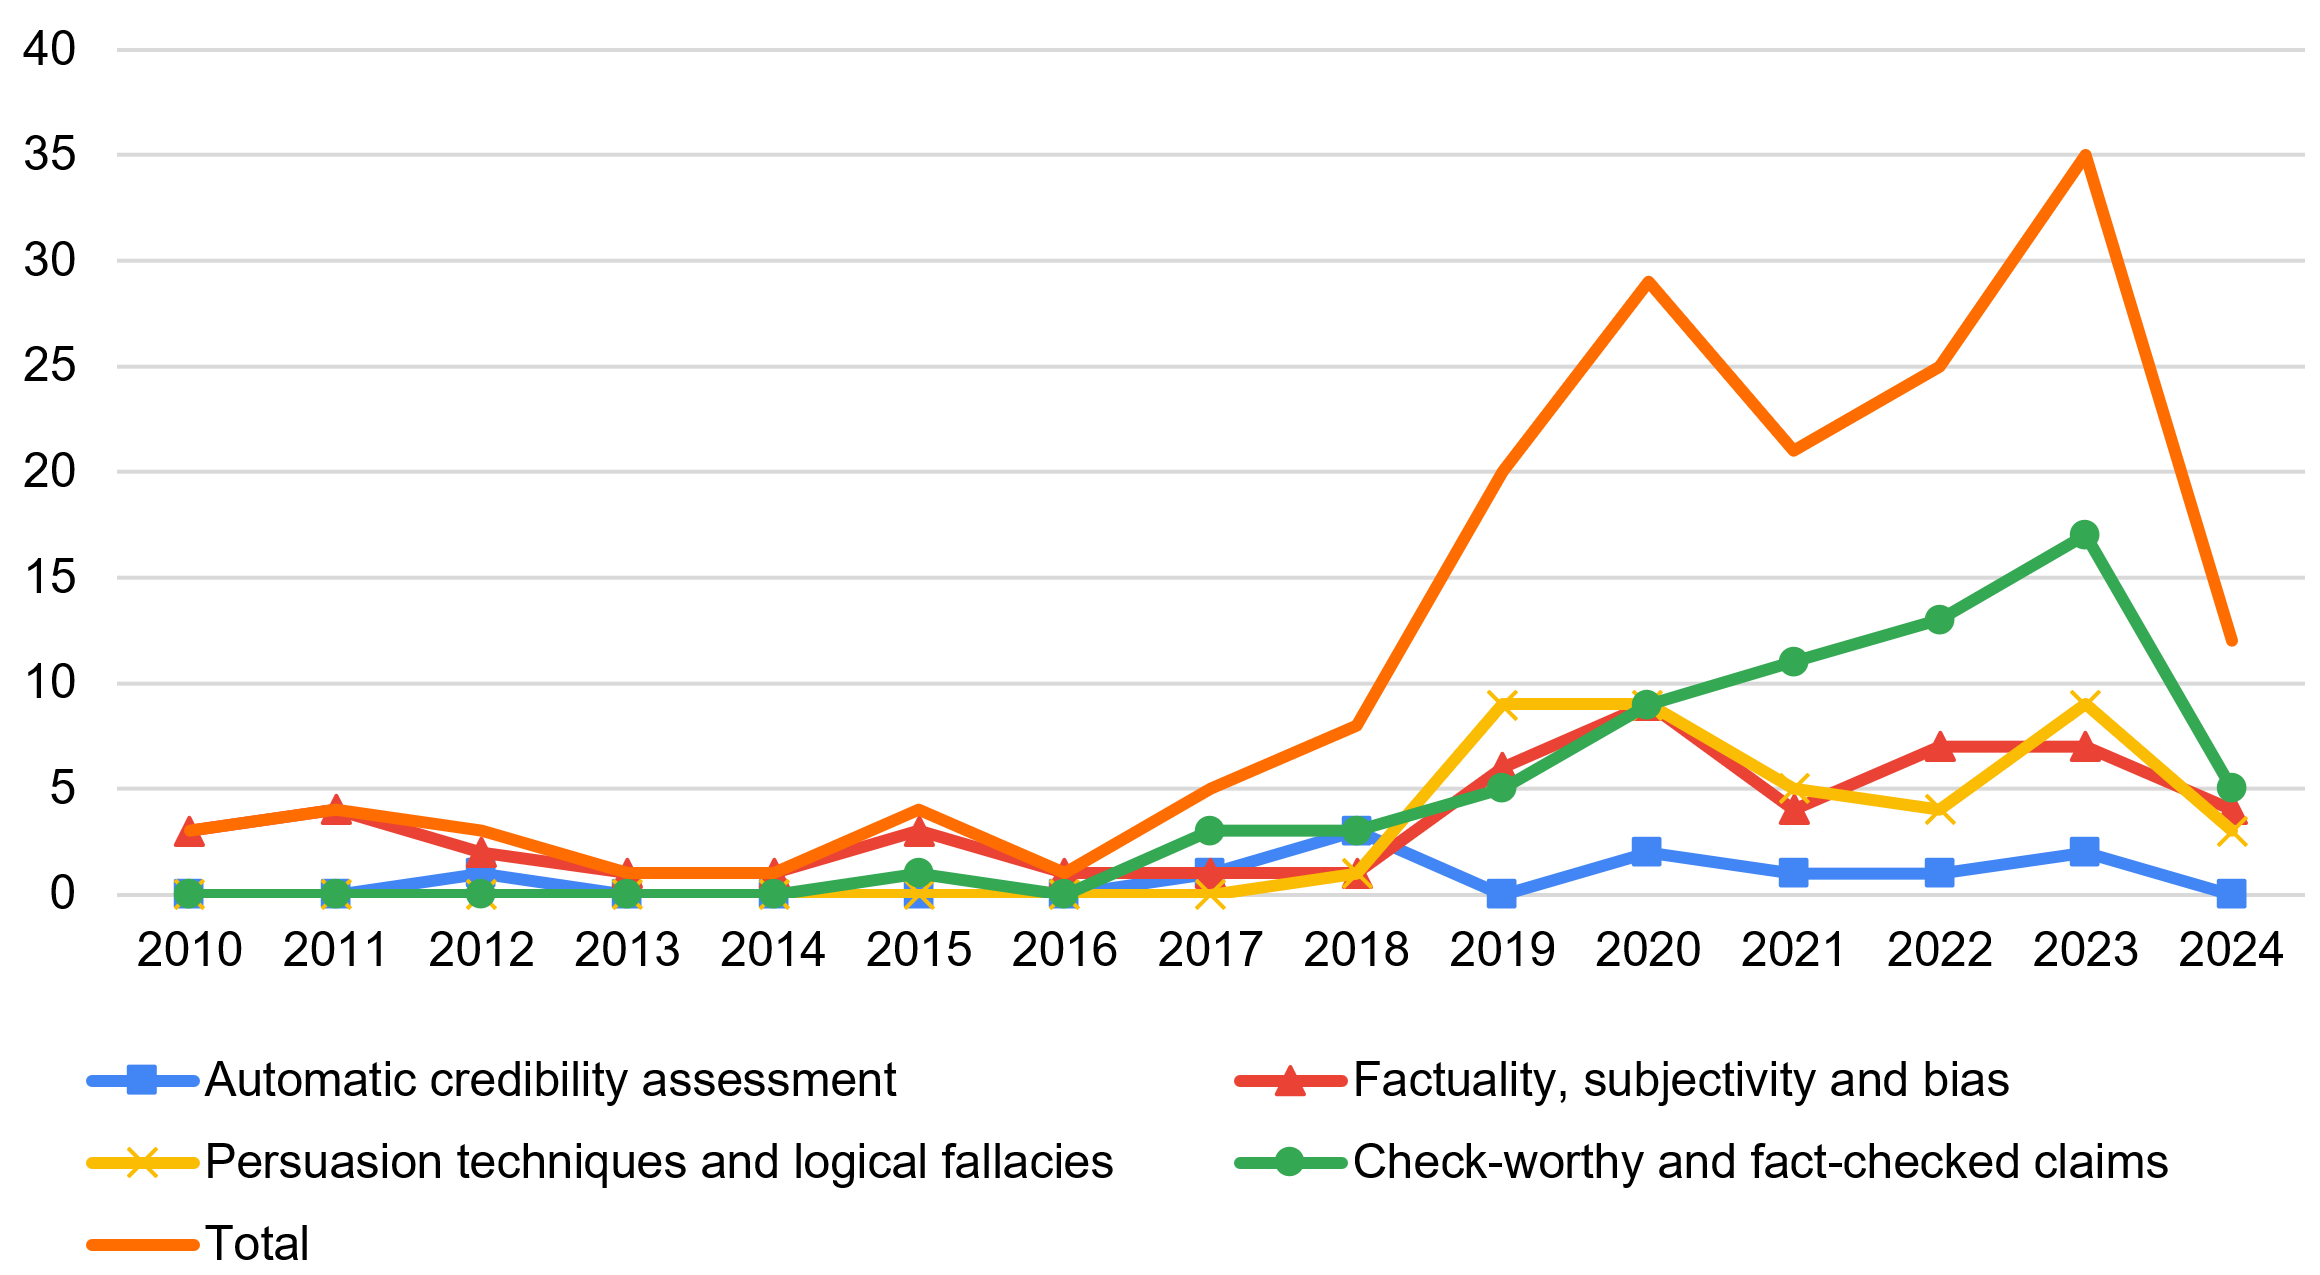
This is a line chart tracking the annual number of publications (or a similar metric) across five distinct research categories from 2010 to 2024. The chart illustrates the growth and fluctuation of research activity in sub-fields related to automated credibility assessment, factuality, persuasion, and fact-checking.
### Components/Axes
* **X-Axis (Horizontal):** Represents time in years, with markers for each year from **2010** to **2024**.
* **Y-Axis (Vertical):** Represents a numerical count (likely number of publications). The scale runs from **0** to **40**, with major gridlines at intervals of 5.
* **Legend:** Located at the bottom of the chart, it defines five data series:
1. **Automatic credibility assessment:** Blue line with square markers.
2. **Factuality, subjectivity and bias:** Red line with triangle markers.
3. **Persuasion techniques and logical fallacies:** Yellow line with "X" markers.
4. **Check-worthy and fact-checked claims:** Green line with circle markers.
5. **Total:** Thick orange line with no distinct marker.
### Detailed Analysis
**Trend Verification & Data Points (Approximate Values):**
* **Automatic credibility assessment (Blue, Squares):**
* **Trend:** Remains consistently low and flat throughout the entire period, with minor fluctuations near the baseline.
* **Data Points:** Hovers between 0 and 2. Peaks at ~2 in 2018 and 2023. Ends at 0 in 2024.
* **Factuality, subjectivity and bias (Red, Triangles):**
* **Trend:** Shows a very gradual, low-level increase from 2010, with a more noticeable rise starting around 2019.
* **Data Points:** Starts at ~3 in 2010. Fluctuates between 1-4 until 2018. Rises to ~6 in 2019, dips to ~4 in 2021, peaks at ~7 in 2022/2023, and falls to ~4 in 2024.
* **Persuasion techniques and logical fallacies (Yellow, X's):**
* **Trend:** Near zero until a sharp increase in 2019, followed by volatility.
* **Data Points:** ~0 from 2010-2018. Jumps to ~9 in 2019. Fluctuates: ~9 (2020), ~5 (2021), ~4 (2022), ~9 (2023), ~3 (2024).
* **Check-worthy and fact-checked claims (Green, Circles):**
* **Trend:** Shows the most consistent and significant growth among the sub-categories, starting from near zero and rising steadily, especially after 2016.
* **Data Points:** ~0 from 2010-2016. Begins rising: ~3 (2017), ~3 (2018), ~5 (2019), ~9 (2020), ~11 (2021), ~13 (2022), peaks at ~17 (2023), then drops sharply to ~5 (2024).
* **Total (Thick Orange Line):**
* **Trend:** Represents the aggregate of the other categories. It shows a dramatic, accelerating increase starting around 2017, with significant peaks and a notable dip.
* **Data Points:** Fluctuates between 1-5 from 2010-2016. Begins a steep climb: ~5 (2017), ~8 (2018), ~20 (2019), peaks at ~29 (2020). Dips to ~21 (2021), rises to ~25 (2022), reaches its highest peak at ~35 (2023), then falls sharply to ~12 (2024).
### Key Observations
1. **Dominant Growth Phase:** The period from **2019 to 2023** shows explosive growth in total research output and in most sub-categories, particularly "Check-worthy and fact-checked claims."
2. **2020 Peak & 2021 Dip:** The "Total" line shows a major peak in 2020, followed by a dip in 2021, before rising again to an all-time high in 2023.
3. **Category Divergence:** "Check-worthy and fact-checked claims" (green) emerged as the dominant sub-category from 2020 onward, significantly outpacing the others. "Automatic credibility assessment" (blue) remained a niche area throughout.
4. **2024 Decline:** All categories, including the Total, show a sharp decline in 2024. This could indicate incomplete data for the year or a genuine reduction in output.
5. **Low Baseline (2010-2016):** Research activity across all measured categories was minimal and relatively stable for the first seven years of the chart.
### Interpretation
The data suggests a significant and rapid expansion of academic or technical research interest in the fields of misinformation, fact-checking, and persuasion analysis, beginning around **2017-2018** and accelerating dramatically through the early 2020s. This timeline correlates with global events and heightened public discourse around "fake news," election integrity, and the role of social media in information dissemination.
The dominance of the "Check-worthy and fact-checked claims" category indicates a strong research focus on the practical, applied side of identifying and verifying claims, rather than purely theoretical or automated system development ("Automatic credibility assessment"). The volatility in categories like "Persuasion techniques" may reflect shifting research priorities or the influence of specific events that spurred investigation into particular rhetorical strategies.
The sharp peaks in 2020 and 2023, followed by declines, could represent cycles of intense research activity responding to major events (e.g., elections, pandemics) or the publication of large, influential datasets or shared tasks that spurred a wave of publications. The uniform drop in 2024 is striking and warrants verification; if accurate, it might signal a maturation of the field, a shift in funding, or a change in publication venues not captured by this dataset. Overall, the chart depicts a research domain that moved from the periphery to the center of attention within a decade.