## Line Chart: Trends in Information Quality Metrics (2010-2024)
### Overview
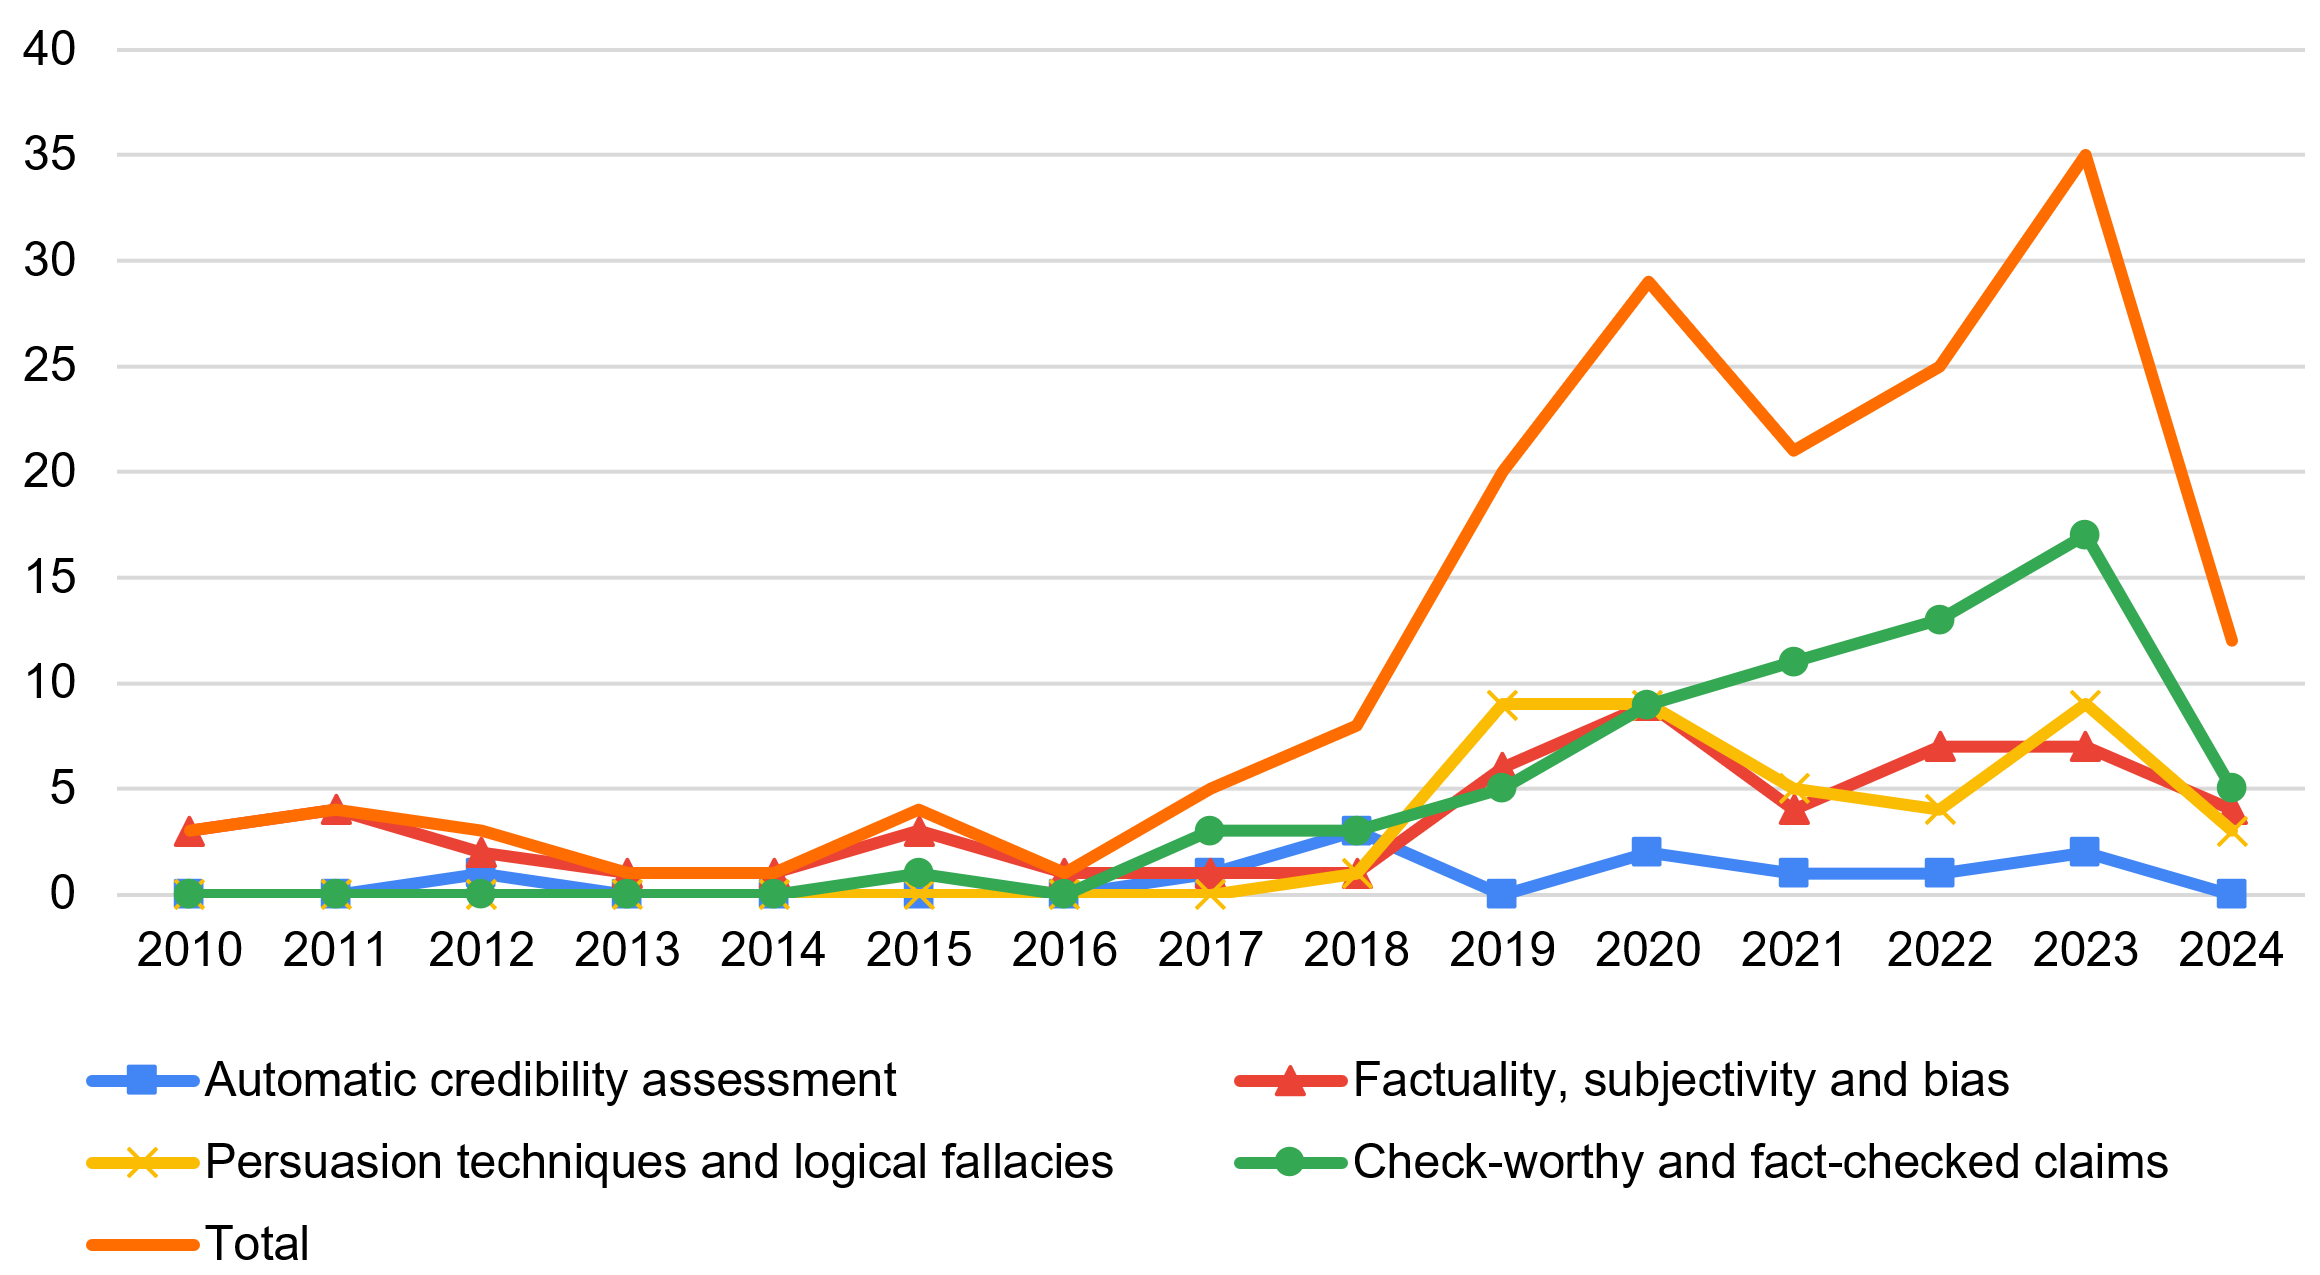
The chart displays four overlapping time-series metrics tracking information quality components from 2010 to 2024. The orange "Total" line represents cumulative values, while three colored lines show individual components: blue (Automatic credibility), red (Factuality), yellow (Persuasion techniques), and green (Check-worthy claims).
### Components/Axes
- **X-axis**: Years (2010-2024) with annual markers
- **Y-axis**: Numerical scale (0-40) with increments of 5
- **Legend**: Located at bottom center, color-coded with:
- Blue squares: Automatic credibility assessment
- Red triangles: Factuality, subjectivity and bias
- Yellow crosses: Persuasion techniques and logical fallacies
- Green circles: Check-worthy and fact-checked claims
- Orange line: Total (sum of components)
### Detailed Analysis
1. **Automatic credibility assessment (blue)**:
- Starts at ~0.5 in 2010
- Peaks at ~2 in 2019
- Drops to ~0.5 in 2024
- Shows cyclical pattern with 2019 as highest point
2. **Factuality, subjectivity and bias (red)**:
- Begins at ~3 in 2010
- Peaks at ~8 in 2020
- Drops to ~4 in 2024
- Shows volatility with 2020 as peak year
3. **Persuasion techniques and logical fallacies (yellow)**:
- Starts at 0 in 2010
- Peaks at ~9 in 2020
- Drops to ~3 in 2024
- Sharp rise in 2019-2020 followed by decline
4. **Check-worthy and fact-checked claims (green)**:
- Starts at 0 in 2010
- Peaks at ~17 in 2023
- Drops to ~5 in 2024
- Shows exponential growth until 2023
5. **Total (orange)**:
- Begins at ~3 in 2010
- Peaks at ~35 in 2023
- Drops to ~12 in 2024
- Shows dramatic spike in 2023 followed by sharp decline
### Key Observations
- **2023 Anomaly**: Green line (Check-worthy claims) shows 17-unit spike, driving total to 35
- **2020 Peak**: Red and yellow lines reach highest values simultaneously (~8 and ~9)
- **2024 Correction**: All components except green show significant drops
- **Green Dominance**: Check-worthy claims account for 58% of 2023 total (17/35)
### Interpretation
The data reveals a dramatic shift in information quality metrics around 2023, with check-worthy claims becoming the dominant factor. The 2024 decline suggests either improved verification processes or reduced content production. The 2020 peak in persuasion techniques and factuality indicates a period of heightened misinformation, while the automatic credibility assessment remains relatively stable throughout the period. The total's 2023 spike followed by 2024 correction creates a "hockey stick" pattern, potentially reflecting changes in content moderation policies or algorithmic adjustments in information platforms.