# Technical Document Extraction: Line Graph Analysis
## Chart Description
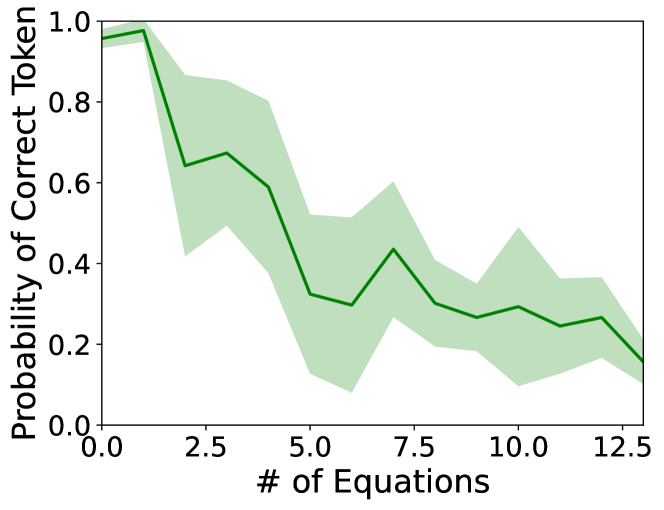
The image depicts a **line graph** illustrating the relationship between the **number of equations** and the **probability of correct token** predictions. The graph includes a shaded area representing variability or confidence intervals around the central trend line.
---
### **Axis Labels and Markers**
- **X-Axis (Horizontal):**
- Title: `# of Equations`
- Range: `0.0` to `12.5`
- Increment: `2.5` (e.g., `0.0`, `2.5`, `5.0`, `7.5`, `10.0`, `12.5`)
- **Y-Axis (Vertical):**
- Title: `Probability of Correct Token`
- Range: `0.0` to `1.0`
- Increment: `0.2` (e.g., `0.0`, `0.2`, `0.4`, `0.6`, `0.8`, `1.0`)
---
### **Legend**
- **Line Color:** Green
- Label: `Probability of Correct Token`
- **Shaded Area:** Light green
- Purpose: Represents variability or confidence intervals around the trend line.
---
### **Key Data Points and Trends**
1. **Initial Value:**
- At `# of Equations = 0.0`, the probability starts at **~0.95**.
2. **General Trend:**
- The probability **declines steadily** as the number of equations increases.
- Notable fluctuations occur, with temporary increases (e.g., at `2.5` and `7.5` equations).
3. **Critical Thresholds:**
- **`2.5 Equations`:** Probability drops to **~0.65**.
- **`5.0 Equations`:** Further decline to **~0.55**.
- **`7.5 Equations`:** Temporary rise to **~0.4**, followed by a drop.
- **`10.0 Equations`:** Probability stabilizes around **~0.3**.
- **`12.5 Equations`:** Final value reaches **~0.15**.
4. **Shaded Area Behavior:**
- The variability (shaded region) widens significantly between `0.0` and `2.5` equations, then narrows as the number of equations increases.
---
### **Summary**
The graph demonstrates an **inverse relationship** between the number of equations and the probability of correct token predictions. While the trend is generally downward, localized fluctuations suggest variability in model performance under specific conditions. The shaded area highlights uncertainty, which decreases as the number of equations grows.