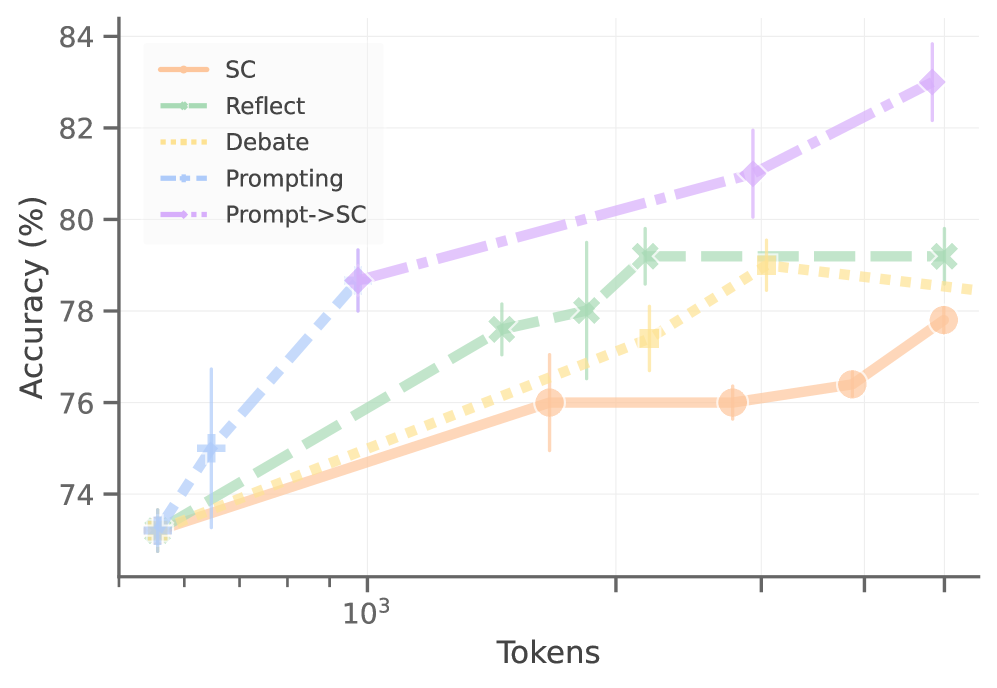
# Technical Data Extraction: Accuracy vs. Tokens Line Graph
## 1. Component Isolation
* **Header:** None present.
* **Main Chart:** A line graph plotted on a semi-logarithmic scale (X-axis is logarithmic, Y-axis is linear). It features five distinct data series with error bars.
* **Legend:** Located in the upper-left quadrant of the chart area.
* **Footer:** None present.
---
## 2. Axis and Metadata Extraction
* **Y-Axis Title:** Accuracy (%)
* **Y-Axis Markers:** 74, 76, 78, 80, 82, 84 (Linear scale)
* **X-Axis Title:** Tokens
* **X-Axis Markers:** $10^3$ (Logarithmic scale). Minor ticks indicate values between $10^2$ and $10^4$.
* **Grid:** Light gray major grid lines corresponding to the primary axis markers.
---
## 3. Legend and Series Identification
| Series Label | Color | Line Style | Marker Shape |
| :--- | :--- | :--- | :--- |
| **SC** | Light Orange | Solid (Thick) | Large Circle |
| **Reflect** | Light Green | Dashed (Long) | 'X' Cross |
| **Debate** | Light Yellow | Dotted (Thick) | Square |
| **Prompting** | Light Blue | Dashed (Short) | '+' Plus |
| **Prompt->SC** | Light Purple | Dash-Dot | Diamond |
---
## 4. Trend Verification and Data Extraction
All series originate from a common baseline at approximately **73.2% accuracy** at the lowest token count (approx. 500 tokens).
### Series 1: SC (Light Orange, Solid, Circle)
* **Trend:** Slowest growth. Slopes upward gradually, plateaus mid-range, then rises again at the end.
* **Data Points (Approx):**
* ~500 tokens: 73.2%
* ~2000 tokens: 76.0%
* ~4000 tokens: 76.0%
* ~6000 tokens: 76.4%
* ~9000 tokens: 77.8%
### Series 2: Reflect (Light Green, Long Dash, 'X')
* **Trend:** Steady upward slope, outperforming SC and Debate initially, then plateaus at the highest token counts.
* **Data Points (Approx):**
* ~1500 tokens: 77.6%
* ~2000 tokens: 78.0%
* ~3000 tokens: 79.2%
* ~9000 tokens: 79.2% (Plateau)
### Series 3: Debate (Light Yellow, Dotted, Square)
* **Trend:** Linear upward slope on the log scale. It stays between SC and Reflect for most of the duration.
* **Data Points (Approx):**
* ~3000 tokens: 77.4%
* ~5000 tokens: 79.0%
* ~10000 tokens: 78.5% (Slight dip/plateau at end)
### Series 4: Prompting (Light Blue, Short Dash, '+')
* **Trend:** Sharpest initial increase. This series transitions into the "Prompt->SC" series after the first few data points.
* **Data Points (Approx):**
* ~500 tokens: 73.2%
* ~650 tokens: 75.0%
* ~950 tokens: 78.7% (Transition point)
### Series 5: Prompt->SC (Light Purple, Dash-Dot, Diamond)
* **Trend:** Highest overall performance. Continues the trajectory of the "Prompting" series with a consistent upward slope, ending as the top performer.
* **Data Points (Approx):**
* ~950 tokens: 78.7%
* ~5000 tokens: 81.0%
* ~9000 tokens: 83.0%
---
## 5. Key Observations
* **Scaling Efficiency:** The **Prompt->SC** method (Purple) is the most token-efficient, achieving the highest accuracy (~83%) as token count increases.
* **Performance Floor:** All methods perform similarly at low token counts (~73%).
* **Error Bars:** Vertical error bars are present on all series, indicating variance in accuracy. The variance appears relatively consistent across methods, though "Reflect" (Green) shows a notably large error bar around the 2500 token mark.
* **Saturation:** The "Reflect" method appears to hit a performance ceiling at ~79% accuracy regardless of additional token expenditure beyond 3000 tokens.