# Technical Document Analysis: Line Chart of Model Performance
## Chart Type
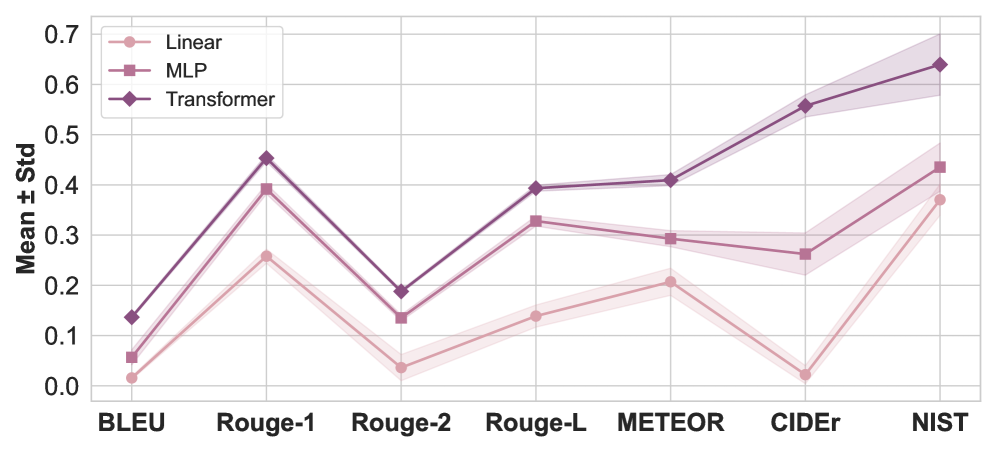
- **Line Chart** comparing model performance across datasets.
## Axis Labels
- **X-Axis**: Datasets (BLEU, Rouge-1, Rouge-2, Rouge-L, METEOR, CIDEr, NIST)
- **Y-Axis**: Mean ± Standard Deviation (ranging from 0.0 to 0.7)
## Legend
- **Position**: Top-right corner
- **Labels & Colors**:
- **Linear**: Pink (light pink)
- **MLP**: Purple (medium purple)
- **Transformer**: Dark Purple (almost black)
## Data Points & Trends
### Linear Model (Pink)
- **Trend**:
- Starts low at BLEU (~0.02), peaks at Rouge-1 (~0.26), dips at Rouge-2 (~0.04) and CIDEr (~0.02), then rises sharply at NIST (~0.37).
- **Values**:
- BLEU: 0.02
- Rouge-1: 0.26
- Rouge-2: 0.04
- Rouge-L: 0.14
- METEOR: 0.21
- CIDEr: 0.02
- NIST: 0.37
### MLP Model (Purple)
- **Trend**:
- Gradual increase from BLEU (~0.06) to NIST (~0.44), with minor fluctuations.
- **Values**:
- BLEU: 0.06
- Rouge-1: 0.39
- Rouge-2: 0.13
- Rouge-L: 0.33
- METEOR: 0.30
- CIDEr: 0.26
- NIST: 0.44
### Transformer Model (Dark Purple)
- **Trend**:
- Consistently upward slope from BLEU (~0.13) to NIST (~0.64), with the steepest rise between CIDEr and NIST.
- **Values**:
- BLEU: 0.13
- Rouge-1: 0.46
- Rouge-2: 0.19
- Rouge-L: 0.39
- METEOR: 0.41
- CIDEr: 0.55
- NIST: 0.64
## Shaded Regions
- **Purpose**: Represent standard deviation (error margins) around mean values.
- **Observations**:
- Transformer has the widest shaded regions, indicating higher variability.
- Linear model shows the narrowest shaded regions, suggesting more consistent performance.
## Spatial Grounding
- **Legend Position**: Top-right (coordinates: [x: 0.8, y: 0.9] relative to chart bounds).
- **Color Consistency**:
- All data points match legend colors (e.g., pink for Linear, dark purple for Transformer).
## Component Isolation
1. **Header**: Chart title (not explicitly labeled but inferred as "Model Performance").
2. **Main Chart**:
- Three lines (Linear, MLP, Transformer) plotted against datasets.
- Shaded regions for error margins.
3. **Footer**: No explicit footer text.
## Additional Notes
- **Language**: All text is in English.
- **Data Table Reconstruction**:
| Dataset | Linear | MLP | Transformer |
|-----------|--------|------|-------------|
| BLEU | 0.02 | 0.06 | 0.13 |
| Rouge-1 | 0.26 | 0.39 | 0.46 |
| Rouge-2 | 0.04 | 0.13 | 0.19 |
| Rouge-L | 0.14 | 0.33 | 0.39 |
| METEOR | 0.21 | 0.30 | 0.41 |
| CIDEr | 0.02 | 0.26 | 0.55 |
| NIST | 0.37 | 0.44 | 0.64 |
## Key Observations
1. **Transformer Dominance**: Outperforms other models across all datasets, especially NIST (0.64).
2. **Linear Model Variability**: Poor performance at BLEU, Rouge-2, and CIDEr but excels at NIST.
3. **MLP Consistency**: Moderate performance with minimal fluctuations.
4. **Error Margins**: Transformer’s wider shaded regions suggest less reliable predictions compared to Linear/MLP.