# Technical Document Extraction: Performance Comparison of Model Architectures
## 1. Image Overview
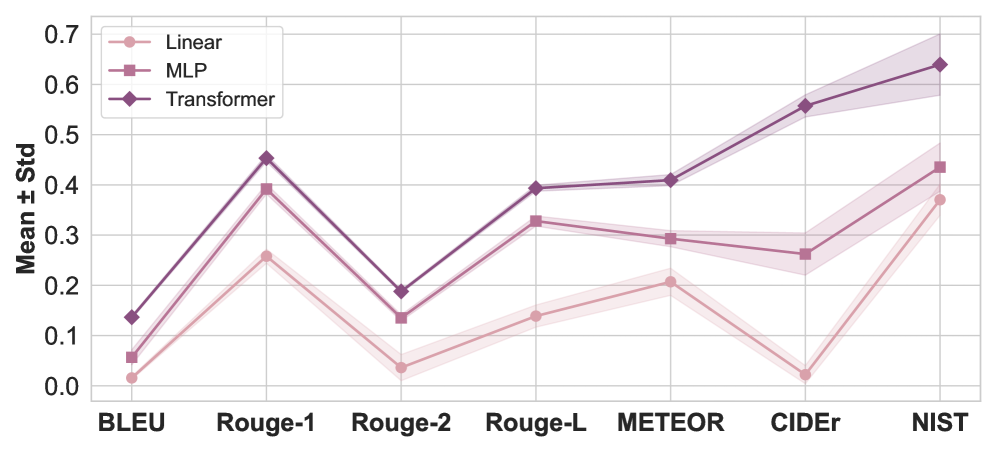
This image is a line graph comparing the performance of three different machine learning architectures (**Linear**, **MLP**, and **Transformer**) across seven distinct evaluation metrics. The y-axis represents the mean score with a shaded region indicating the standard deviation (Mean ± Std).
## 2. Component Isolation
### A. Header / Legend
* **Location:** Top-left quadrant of the chart area.
* **Content:**
* **Linear:** Represented by a light pink line with circular markers (●).
* **MLP:** Represented by a medium mauve line with square markers (■).
* **Transformer:** Represented by a dark purple line with diamond markers (◆).
### B. Main Chart Area (Axes)
* **Y-Axis Label:** "Mean ± Std"
* **Y-Axis Scale:** Numerical range from 0.0 to 0.7, with major gridlines every 0.1 units.
* **X-Axis Labels (Categories):**
1. BLEU
2. Rouge-1
3. Rouge-2
4. Rouge-L
5. METEOR
6. CIDEr
7. NIST
### C. Visual Trends and Logic Check
* **Transformer (Dark Purple):** Consistently the highest-performing architecture across all metrics. It shows a significant peak at Rouge-1, a dip at Rouge-2, and a strong upward trajectory from METEOR through NIST.
* **MLP (Medium Mauve):** Consistently occupies the middle performance tier. It follows a similar shape to the Transformer but at a lower magnitude. Notably, its performance dips slightly between METEOR and CIDEr before rising for NIST.
* **Linear (Light Pink):** The lowest-performing architecture. It follows the general "M" shape of the Rouge metrics but drops significantly at CIDEr (nearly to 0.0) before recovering for NIST.
## 3. Data Extraction (Estimated Values)
The following table reconstructs the data points based on the visual alignment with the y-axis gridlines.
| Metric | Linear (Light Pink ●) | MLP (Medium Mauve ■) | Transformer (Dark Purple ◆) |
| :--- | :--- | :--- | :--- |
| **BLEU** | ~0.02 | ~0.06 | ~0.14 |
| **Rouge-1** | ~0.26 | ~0.39 | ~0.45 |
| **Rouge-2** | ~0.04 | ~0.14 | ~0.19 |
| **Rouge-L** | ~0.14 | ~0.33 | ~0.39 |
| **METEOR** | ~0.21 | ~0.29 | ~0.41 |
| **CIDEr** | ~0.02 | ~0.26 | ~0.56 |
| **NIST** | ~0.37 | ~0.44 | ~0.64 |
## 4. Detailed Observations
* **Standard Deviation:** The shaded regions indicate the variance in performance. The **Transformer** model shows a noticeably wider standard deviation (higher variance) on the **NIST** and **CIDEr** metrics compared to the other models.
* **Metric Correlation:** All three models show a sharp performance drop when moving from **Rouge-1** to **Rouge-2**, and a sharp increase when moving from **CIDEr** to **NIST**.
* **Performance Gap:** The performance gap between the Transformer and the other models is most pronounced in the **CIDEr** and **NIST** metrics, where the Transformer significantly outperforms the Linear and MLP baselines.
* **Linear Model Anomaly:** The Linear model performs exceptionally poorly on the **CIDEr** metric, nearly touching the 0.0 baseline, whereas the MLP and Transformer maintain much higher relative scores.