TECHNICAL ASSET FINGERPRINT
eca4f3d44d3cfc54a3971b2c
Click to view fullscreen
Press ESC or click to close
FOUND IN PAPERS
EXPERT: healer-alpha-free VERSION 1
RUNTIME: free/openrouter/healer-alpha
INTEL_VERIFIED
\n
## Diagram: Iterative Code Generation with Feedback
### Overview
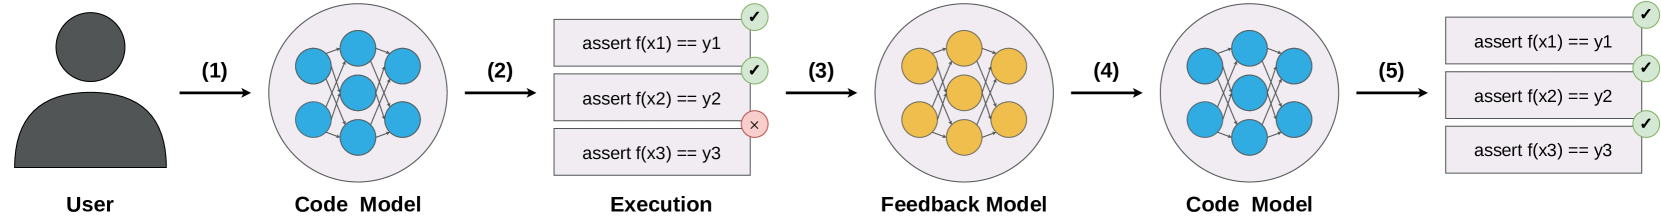
The image is a horizontal flowchart illustrating a five-step iterative process for generating and refining code using machine learning models. The process begins with a user, involves two distinct code models (represented by blue and yellow neural network icons), an execution/testing phase, and a feedback model. The diagram visually depicts a cycle where an initial code model produces code that fails some tests, leading to a feedback model that informs a subsequent code model to produce corrected code that passes all tests.
### Components/Axes
The diagram is composed of five main stages connected by numbered, right-pointing arrows indicating the flow of the process. Each stage is labeled below its corresponding visual element.
1. **Stage (1): User**
* **Visual:** A simple, dark gray icon of a person's head and shoulders.
* **Label:** "User" (centered below the icon).
* **Position:** Far left of the diagram.
2. **Stage (2): Code Model (Initial)**
* **Visual:** A light gray circle containing a neural network diagram with **blue nodes** (7 nodes: 3 input, 2 hidden, 2 output) connected by lines.
* **Label:** "Code Model" (centered below the circle).
* **Position:** To the right of the User, connected by arrow (1).
3. **Stage (3): Execution**
* **Visual:** A vertical stack of three rectangular boxes, each containing a line of code (an assertion). To the right of each box is a status icon.
* **Label:** "Execution" (centered below the stack).
* **Content & Status:**
* Top box: `assert f(x1) == y1` | Status: Green circle with a white checkmark (✓).
* Middle box: `assert f(x2) == y2` | Status: Green circle with a white checkmark (✓).
* Bottom box: `assert f(x3) == y3` | Status: Red circle with a white 'X' (✗).
* **Position:** To the right of the initial Code Model, connected by arrow (2).
4. **Stage (4): Feedback Model**
* **Visual:** A light gray circle containing a neural network diagram with **yellow nodes** (7 nodes: 3 input, 2 hidden, 2 output) connected by lines.
* **Label:** "Feedback Model" (centered below the circle).
* **Position:** To the right of the Execution stage, connected by arrow (3).
5. **Stage (5): Code Model (Refined)**
* **Visual:** A light gray circle containing a neural network diagram with **blue nodes** (identical structure to the initial Code Model).
* **Label:** "Code Model" (centered below the circle).
* **Position:** To the right of the Feedback Model, connected by arrow (4).
6. **Final Output: Corrected Execution**
* **Visual:** A vertical stack of three rectangular boxes, identical in format to the first Execution stage.
* **Label:** None (this is the output of the final Code Model).
* **Content & Status:**
* Top box: `assert f(x1) == y1` | Status: Green circle with a white checkmark (✓).
* Middle box: `assert f(x2) == y2` | Status: Green circle with a white checkmark (✓).
* Bottom box: `assert f(x3) == y3` | Status: Green circle with a white checkmark (✓).
* **Position:** Far right of the diagram, connected to the final Code Model by arrow (5).
### Detailed Analysis
The process flow is explicitly numbered:
* **(1)** The User provides input or a task to the initial **Code Model** (blue).
* **(2)** This Code Model generates a program or function `f`, which is then subjected to **Execution** against three test cases (`x1`, `x2`, `x3`).
* **(3)** The results of the execution (two passes, one failure) are fed into a **Feedback Model** (yellow). This model's distinct color suggests it has a different role, likely analyzing the failure of `f(x3) == y3`.
* **(4)** The Feedback Model provides information (presumably about the error) to a new instance of the **Code Model** (blue).
* **(5)** This refined Code Model generates a corrected program, which is executed again. The final output shows all three assertions now passing.
### Key Observations
1. **Color Coding:** The diagram uses color to distinguish model types. Blue nodes represent the primary code-generating models. Yellow nodes represent the specialized feedback/analysis model.
2. **State Change:** The critical change between the first and second execution is the status of the third assertion (`assert f(x3) == y3`), which changes from a red 'X' (failure) to a green checkmark (success).
3. **Iterative Refinement:** The structure is a classic feedback loop: Generate -> Test -> Analyze Failure -> Regenerate -> Test Successfully.
4. **Identical Final Structure:** The final Code Model and its output are visually identical to the initial Code Model's structure, but the output state is different (all tests pass), implying the model's internal parameters or the code it generated have been updated based on the feedback.
### Interpretation
This diagram illustrates a **self-correcting code generation pipeline**. It demonstrates a method to improve the reliability of AI-generated code by incorporating an execution-based feedback loop.
* **What it suggests:** The process is designed to overcome the limitation of a code model that may produce syntactically correct but logically flawed code for some inputs. Instead of relying solely on the initial model's training, it uses real execution results (test failures) as a training signal.
* **How elements relate:** The **User** initiates the task. The **Code Model** is the primary generator. The **Execution** phase acts as an objective validator. The **Feedback Model** is the crucial diagnostic component that interprets *why* a test failed, translating the execution error into a form the Code Model can use for improvement. The final **Code Model** represents the updated, improved state of the generator.
* **Notable Anomalies/Patterns:** The most significant pattern is the transformation of the third test case from failure to success. This highlights the system's ability to target and fix specific logical errors. The separation of the "Feedback Model" from the "Code Model" suggests a modular architecture where error analysis is a distinct task from code generation, potentially leading to more specialized and effective models. The diagram implies that with this feedback mechanism, the system can achieve 100% test coverage for the given cases, moving from 66% (2/3) to 100% (3/3) success.
DECODING INTELLIGENCE...