## Diagram Type: Flowchart
### Overview
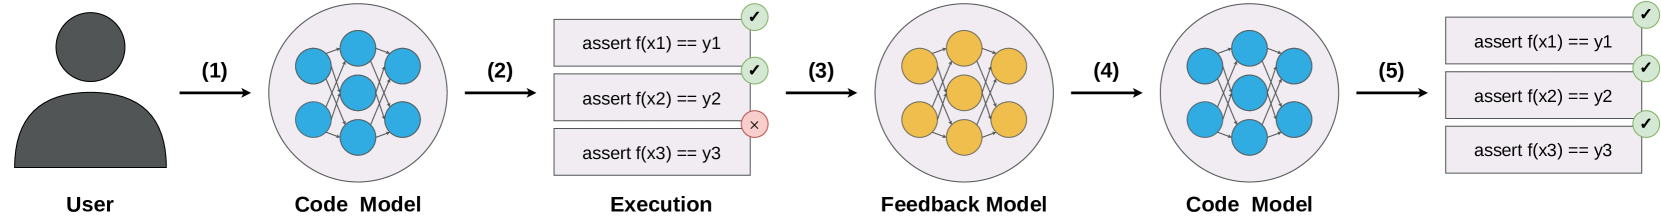
The flowchart illustrates the process of a user interacting with a code model, followed by execution, feedback, and a final code model update.
### Components/Axes
- **User**: Represented by a human figure icon.
- **Code Model**: Depicted by a circle with blue nodes connected by lines.
- **Execution**: Shown by a rectangle with three assertions.
- **Feedback Model**: Illustrated by a circle with yellow nodes connected by lines.
- **Code Model**: Depicted again with blue nodes connected by lines.
### Detailed Analysis or ### Content Details
1. **User**: The user initiates the process.
2. **Code Model**: The code model is presented to the user.
3. **Execution**: The code model is executed, and three assertions are made to verify the output.
4. **Feedback Model**: The feedback model is generated based on the execution results.
5. **Code Model**: The code model is updated based on the feedback.
### Key Observations
- The process starts with the user interacting with the code model.
- The code model is executed, and the output is verified.
- Feedback is generated based on the execution results.
- The code model is updated based on the feedback.
### Interpretation
The flowchart demonstrates the iterative process of code execution and feedback in a machine learning or AI system. The user interacts with the code model, which is then executed and the results are verified. Based on the feedback, the code model is updated, and the process repeats. This cycle is crucial for continuous improvement and refinement of the code model.