## Chart: Accuracy vs. Noise Intensity Coefficient for Different Models
### Overview
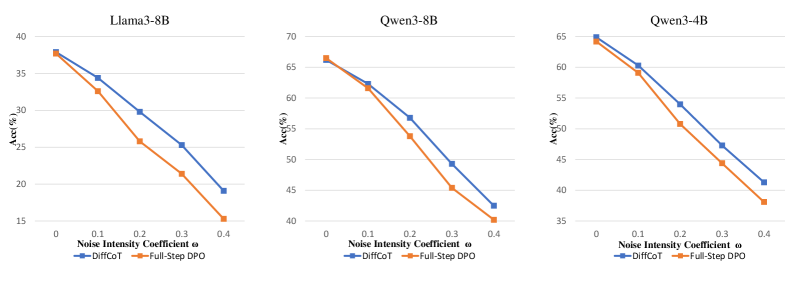
The image presents three line charts comparing the accuracy of two methods, "DiffCoT" and "Full-Step DPO," across different noise intensity coefficients for three models: Llama3-8B, Qwen3-8B, and Qwen3-4B. Each chart plots accuracy (Acc(%)) on the y-axis against the noise intensity coefficient (ω) on the x-axis.
### Components/Axes
* **Titles (Top of each chart):**
* Left: Llama3-8B
* Middle: Qwen3-8B
* Right: Qwen3-4B
* **X-Axis (Horizontal):**
* Label: Noise Intensity Coefficient ω
* Scale: 0, 0.1, 0.2, 0.3, 0.4
* **Y-Axis (Vertical):**
* Label: Acc(%)
* Scale:
* Llama3-8B: 15, 20, 25, 30, 35, 40
* Qwen3-8B: 40, 45, 50, 55, 60, 65, 70
* Qwen3-4B: 35, 40, 45, 50, 55, 60, 65
* **Legend (Bottom of each chart):**
* Blue Line: DiffCoT
* Orange Line: Full-Step DPO
### Detailed Analysis
**Chart 1: Llama3-8B**
* **DiffCoT (Blue):** The accuracy decreases as the noise intensity coefficient increases.
* ω = 0: Acc(%) ≈ 38
* ω = 0.1: Acc(%) ≈ 34
* ω = 0.2: Acc(%) ≈ 30
* ω = 0.3: Acc(%) ≈ 25
* ω = 0.4: Acc(%) ≈ 19
* **Full-Step DPO (Orange):** The accuracy decreases as the noise intensity coefficient increases.
* ω = 0: Acc(%) ≈ 38
* ω = 0.1: Acc(%) ≈ 33
* ω = 0.2: Acc(%) ≈ 26
* ω = 0.3: Acc(%) ≈ 21
* ω = 0.4: Acc(%) ≈ 15
**Chart 2: Qwen3-8B**
* **DiffCoT (Blue):** The accuracy decreases as the noise intensity coefficient increases.
* ω = 0: Acc(%) ≈ 66
* ω = 0.1: Acc(%) ≈ 62
* ω = 0.2: Acc(%) ≈ 57
* ω = 0.3: Acc(%) ≈ 52
* ω = 0.4: Acc(%) ≈ 47
* **Full-Step DPO (Orange):** The accuracy decreases as the noise intensity coefficient increases.
* ω = 0: Acc(%) ≈ 67
* ω = 0.1: Acc(%) ≈ 62
* ω = 0.2: Acc(%) ≈ 54
* ω = 0.3: Acc(%) ≈ 48
* ω = 0.4: Acc(%) ≈ 42
**Chart 3: Qwen3-4B**
* **DiffCoT (Blue):** The accuracy decreases as the noise intensity coefficient increases.
* ω = 0: Acc(%) ≈ 65
* ω = 0.1: Acc(%) ≈ 60
* ω = 0.2: Acc(%) ≈ 54
* ω = 0.3: Acc(%) ≈ 47
* ω = 0.4: Acc(%) ≈ 41
* **Full-Step DPO (Orange):** The accuracy decreases as the noise intensity coefficient increases.
* ω = 0: Acc(%) ≈ 64
* ω = 0.1: Acc(%) ≈ 59
* ω = 0.2: Acc(%) ≈ 51
* ω = 0.3: Acc(%) ≈ 44
* ω = 0.4: Acc(%) ≈ 38
### Key Observations
* For all three models, both DiffCoT and Full-Step DPO show a decrease in accuracy as the noise intensity coefficient increases.
* The Qwen3-8B and Qwen3-4B models generally exhibit higher accuracy than the Llama3-8B model across all noise intensity coefficients.
* The DiffCoT method generally performs slightly better than the Full-Step DPO method, especially at lower noise intensity coefficients.
### Interpretation
The charts demonstrate the impact of noise intensity on the accuracy of different language models and training methods. The consistent downward trend in accuracy as noise increases suggests that both DiffCoT and Full-Step DPO are susceptible to noise. The Qwen3 models appear to be more robust to noise than the Llama3-8B model, potentially indicating differences in their architecture or training data. The slight advantage of DiffCoT over Full-Step DPO suggests that DiffCoT may be a more effective training method for mitigating the effects of noise.