\n
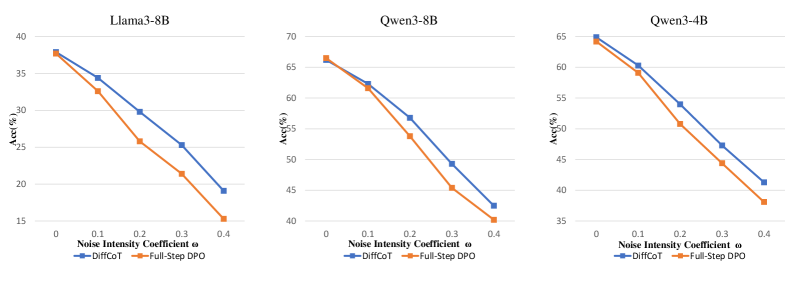
## Line Charts: Accuracy vs. Noise Intensity Coefficient for Different Models
### Overview
The image presents three separate line charts, each depicting the relationship between Accuracy (Acc(%) on the y-axis) and Noise Intensity Coefficient (ω) on the x-axis. Each chart represents a different model: Llama3-8B, Qwen3-8B, and Qwen3-4B. Within each chart, two lines represent different training methods: "DiffCoT" (blue line) and "Full-Step DPO" (orange line). The charts aim to compare the robustness of these models and training methods to increasing levels of noise.
### Components/Axes
* **X-axis Label (all charts):** "Noise Intensity Coefficient ω" with markers at 0.0, 0.1, 0.2, 0.3, and 0.4.
* **Y-axis Label (all charts):** "Acc(%)" with a scale ranging from approximately 15% to 70%.
* **Chart Titles:**
* Left: "Llama3-8B"
* Center: "Qwen3-8B"
* Right: "Qwen3-4B"
* **Legend (bottom-left of each chart):**
* Blue Line: "DiffCoT"
* Orange Line: "Full-Step DPO"
### Detailed Analysis or Content Details
**Llama3-8B (Left Chart):**
* The "DiffCoT" line (blue) starts at approximately 38% accuracy at ω = 0.0 and decreases linearly to approximately 19% accuracy at ω = 0.4.
* The "Full-Step DPO" line (orange) starts at approximately 36% accuracy at ω = 0.0 and decreases more steeply to approximately 17% accuracy at ω = 0.4.
**Qwen3-8B (Center Chart):**
* The "DiffCoT" line (blue) starts at approximately 67% accuracy at ω = 0.0 and decreases linearly to approximately 44% accuracy at ω = 0.4.
* The "Full-Step DPO" line (orange) starts at approximately 65% accuracy at ω = 0.0 and decreases more steeply to approximately 40% accuracy at ω = 0.4.
**Qwen3-4B (Right Chart):**
* The "DiffCoT" line (blue) starts at approximately 63% accuracy at ω = 0.0 and decreases linearly to approximately 48% accuracy at ω = 0.4.
* The "Full-Step DPO" line (orange) starts at approximately 62% accuracy at ω = 0.0 and decreases more steeply to approximately 38% accuracy at ω = 0.4.
### Key Observations
* In all three charts, both training methods show a decrease in accuracy as the noise intensity coefficient increases.
* "Full-Step DPO" consistently exhibits a steeper decline in accuracy compared to "DiffCoT" across all models and noise levels.
* Qwen3-8B and Qwen3-4B generally achieve higher initial accuracy levels (at ω = 0.0) than Llama3-8B.
* The rate of accuracy decline appears relatively consistent for "DiffCoT" across all models.
### Interpretation
The data suggests that increasing noise negatively impacts the accuracy of all three models, regardless of the training method used. "Full-Step DPO" appears to be more sensitive to noise than "DiffCoT," as evidenced by the steeper decline in accuracy. This could indicate that "DiffCoT" provides a more robust training approach in the presence of noisy data. The higher initial accuracy of the Qwen models suggests they may have a stronger baseline performance compared to Llama3-8B. The linear relationship between noise intensity and accuracy decline suggests a predictable degradation in performance as noise levels increase. The consistent trends across all three models indicate that the observed behavior is likely not model-specific but rather a general characteristic of these types of language models when exposed to noise. The charts provide a comparative analysis of model robustness and training method effectiveness under varying noise conditions.