## Line Graphs: Accuracy vs. Noise Intensity Coefficient (α) for Different Models
### Overview
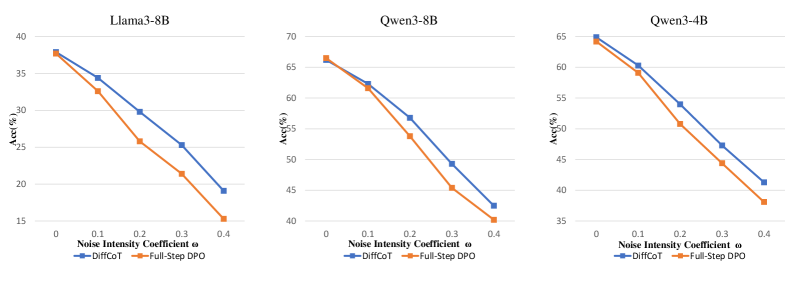
The image contains three line graphs comparing the performance of two methods—**DiffCoT** (blue) and **Full-Step DPO** (orange)—across three language models: **Llama3-8B**, **Qwen3-8B**, and **Qwen3-4B**. Each graph plots accuracy (y-axis, %) against the noise intensity coefficient (α, x-axis, ranging from 0 to 0.4). Both methods show declining accuracy as α increases, but **DiffCoT** consistently outperforms **Full-Step DPO** across all models.
---
### Components/Axes
- **X-axis**: Noise Intensity Coefficient (α) with markers at 0, 0.1, 0.2, 0.3, 0.4.
- **Y-axis**: Accuracy (Acc, %) with increments of 5%.
- **Legends**:
- Blue line: **DiffCoT**
- Orange line: **Full-Step DPO**
- **Graph Titles**:
- Llama3-8B (left)
- Qwen3-8B (center)
- Qwen3-4B (right)
---
### Detailed Analysis
#### Llama3-8B
- **DiffCoT**: Starts at ~38% (α=0), declines to ~19% (α=0.4).
- **Full-Step DPO**: Starts at ~38% (α=0), declines to ~15% (α=0.4).
- **Trend**: Both methods show a steep downward slope, with **DiffCoT** maintaining a ~3–5% advantage.
#### Qwen3-8B
- **DiffCoT**: Starts at ~66% (α=0), declines to ~42% (α=0.4).
- **Full-Step DPO**: Starts at ~66% (α=0), declines to ~40% (α=0.4).
- **Trend**: Similar to Llama3-8B, but with higher absolute accuracy values. The gap between methods narrows slightly at α=0.4.
#### Qwen3-4B
- **DiffCoT**: Starts at ~64% (α=0), declines to ~41% (α=0.4).
- **Full-Step DPO**: Starts at ~64% (α=0), declines to ~38% (α=0.4).
- **Trend**: Steeper decline compared to other models. **DiffCoT** retains a ~3% edge at α=0.4.
---
### Key Observations
1. **Consistent Performance Gap**: **DiffCoT** outperforms **Full-Step DPO** across all models and α values.
2. **Model Sensitivity**:
- **Qwen3-4B** shows the steepest decline in accuracy for both methods, suggesting higher sensitivity to noise.
- **Llama3-8B** exhibits the least sensitivity, with a smaller drop in accuracy.
3. **Noise Impact**: Accuracy decreases non-linearly as α increases, with sharper drops at higher α values.
---
### Interpretation
The data demonstrates that **DiffCoT** is more robust to noise than **Full-Step DPO** across all tested models. This could indicate that **DiffCoT**’s methodology (e.g., incremental noise injection during training) better prepares models for noisy environments. The steeper decline in **Qwen3-4B** suggests architectural or training differences that make it more vulnerable to noise. Practically, **DiffCoT** may be preferable for applications requiring noise resilience, while **Full-Step DPO** might suffice in cleaner environments. Further investigation into the noise-handling mechanisms of these methods could clarify their relative strengths.