## Bar Chart: Total Energy Consumption Comparison
### Overview
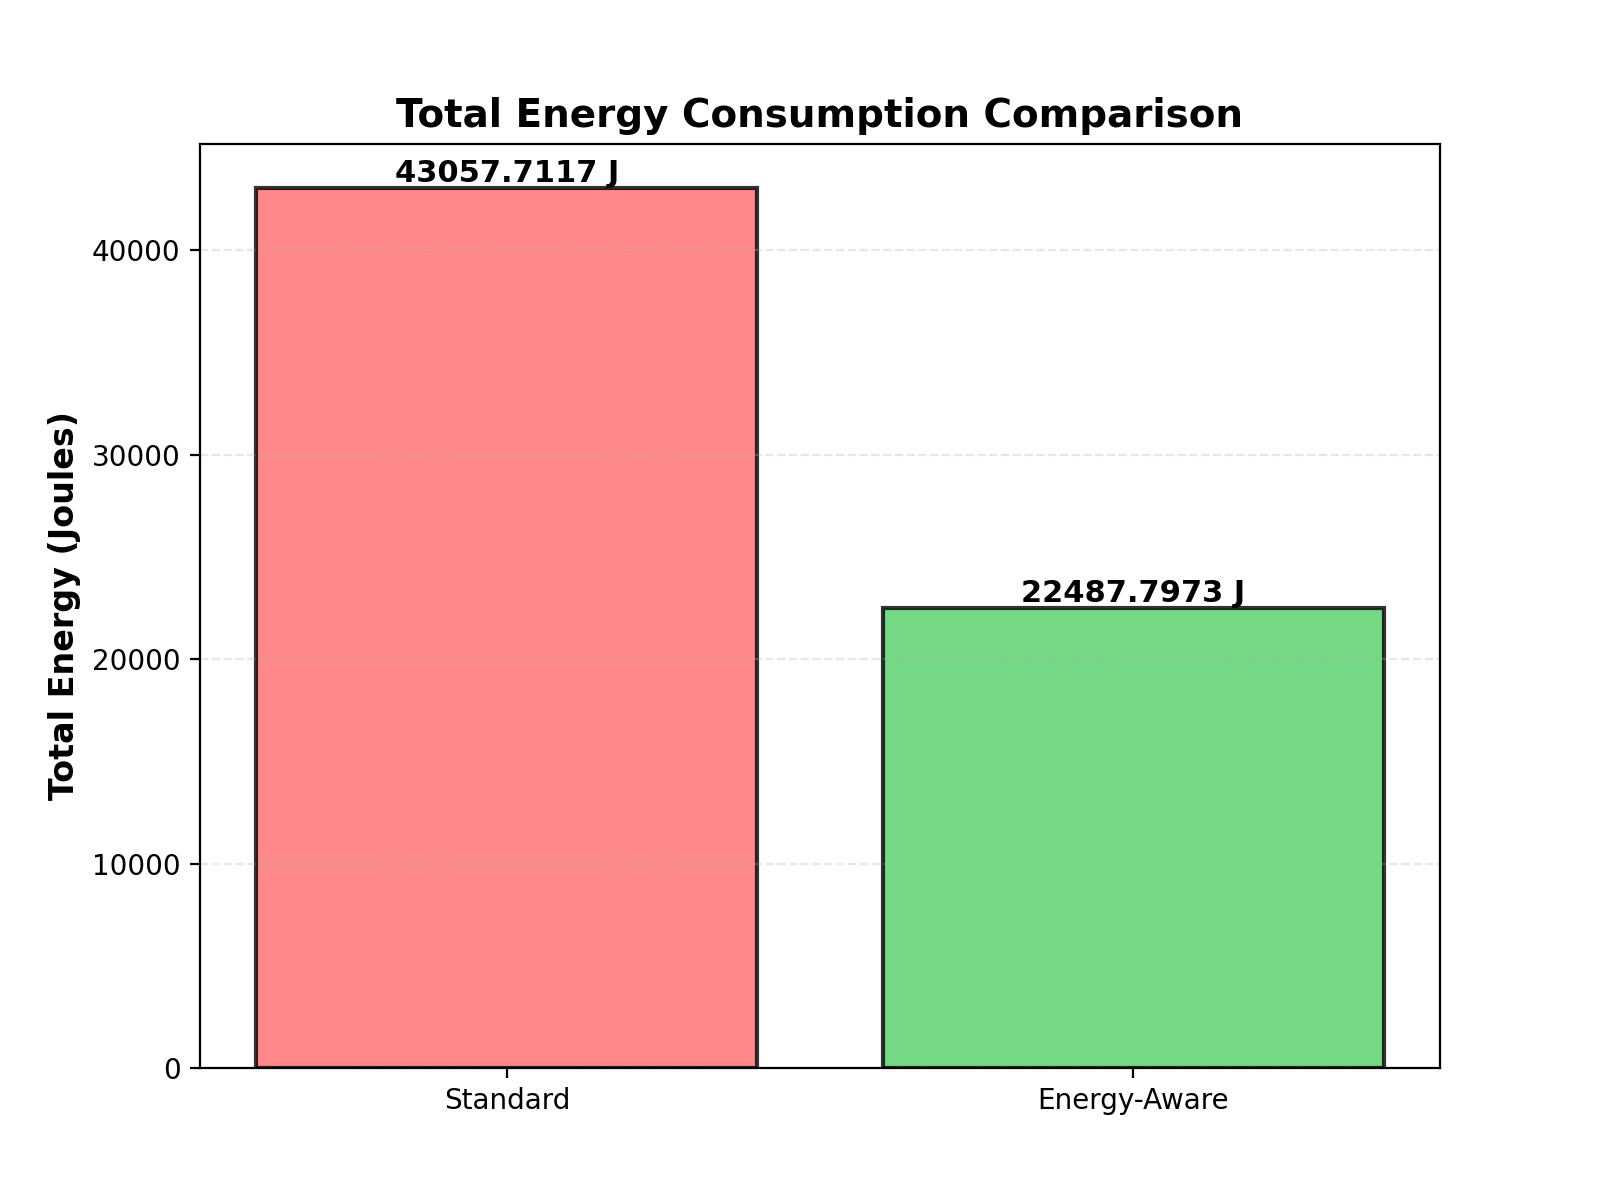
The image is a bar chart comparing the total energy consumption of "Standard" and "Energy-Aware" systems. The chart displays the energy consumption in Joules (J) for each system. The "Standard" system consumes significantly more energy than the "Energy-Aware" system.
### Components/Axes
* **Title:** Total Energy Consumption Comparison
* **X-axis:** Categorical axis with two categories: "Standard" and "Energy-Aware".
* **Y-axis:** Numerical axis labeled "Total Energy (Joules)" with a scale from 0 to 40000, with tick marks at 0, 10000, 20000, 30000, and 40000.
* **Data Labels:** Numerical values are displayed above each bar, indicating the exact energy consumption in Joules.
* **Gridlines:** Horizontal dashed gridlines are present at intervals of 10000 Joules.
### Detailed Analysis
* **Standard:** The "Standard" system has a total energy consumption of 43057.7117 J. The bar is colored light red with a black border.
* **Energy-Aware:** The "Energy-Aware" system has a total energy consumption of 22487.7973 J. The bar is colored light green with a black border.
### Key Observations
* The "Standard" system consumes approximately twice as much energy as the "Energy-Aware" system.
* The exact energy consumption values are provided above each bar, allowing for precise comparison.
### Interpretation
The bar chart clearly demonstrates that the "Energy-Aware" system is significantly more energy-efficient than the "Standard" system. The "Energy-Aware" system consumes approximately half the energy of the "Standard" system. This suggests that implementing energy-aware strategies can lead to substantial reductions in energy consumption.