\n
## Bar Chart: Total Energy Consumption Comparison
### Overview
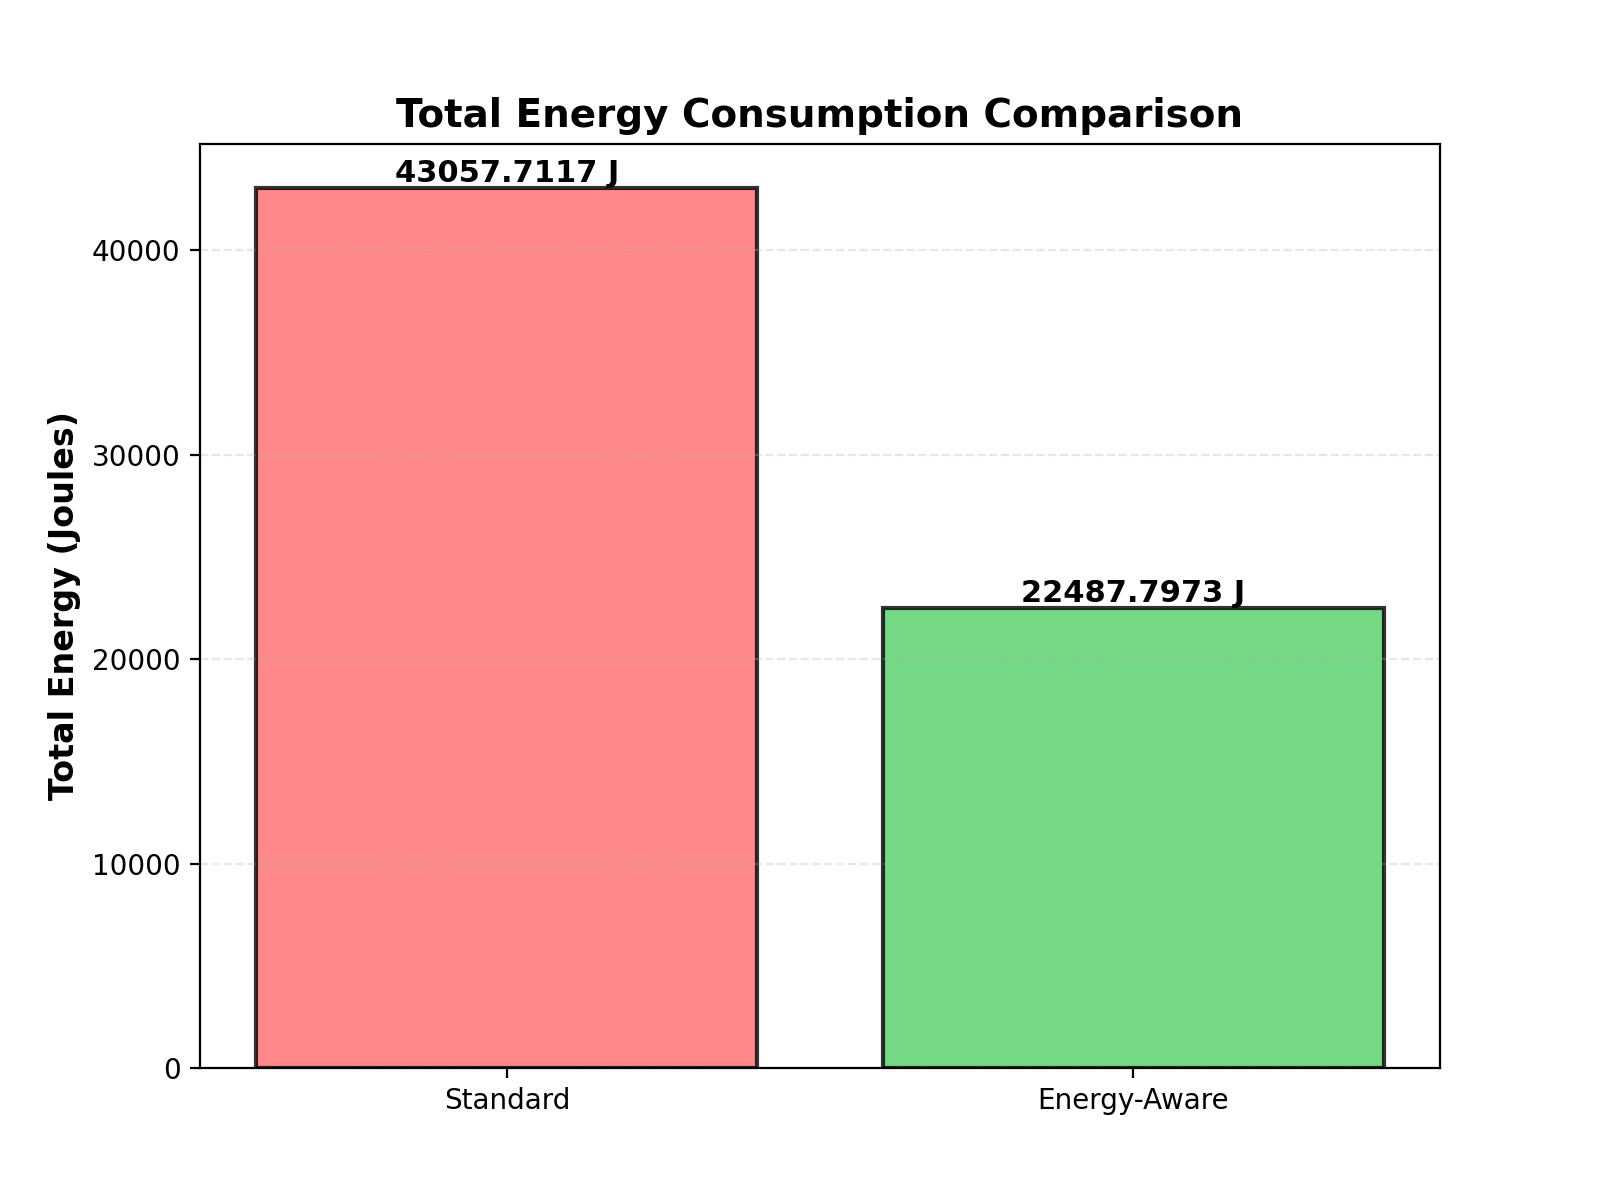
The image presents a bar chart comparing the total energy consumption between two modes: "Standard" and "Energy-Aware". The chart visually represents the energy consumption in Joules.
### Components/Axes
* **Title:** "Total Energy Consumption Comparison" (positioned at the top-center)
* **X-axis:** Represents the modes of operation: "Standard" and "Energy-Aware".
* **Y-axis:** Represents "Total Energy (Joules)", ranging from 0 to 40000, with increments of 10000.
* **Bars:** Two vertical bars representing the energy consumption for each mode.
* "Standard" bar is colored in a shade of red.
* "Energy-Aware" bar is colored in a shade of green.
* **Data Labels:** Numerical values are displayed above each bar, indicating the total energy consumption in Joules.
### Detailed Analysis
* **Standard Mode:** The red bar for "Standard" mode has a height corresponding to approximately 43057.7117 Joules.
* **Energy-Aware Mode:** The green bar for "Energy-Aware" mode has a height corresponding to approximately 22487.7973 Joules.
* The "Standard" bar is significantly taller than the "Energy-Aware" bar, indicating higher energy consumption in Standard mode.
### Key Observations
* The energy consumption in "Standard" mode is almost double that of "Energy-Aware" mode.
* The chart clearly demonstrates the energy-saving benefits of using the "Energy-Aware" mode.
### Interpretation
The data suggests that switching to "Energy-Aware" mode can significantly reduce energy consumption. The difference in energy usage between the two modes is substantial, indicating a potentially large impact on energy costs and environmental sustainability. The chart is a straightforward comparison, and there are no apparent outliers or anomalies. The data strongly supports the adoption of the "Energy-Aware" mode to minimize energy waste. The chart is designed to be easily understood and highlights the effectiveness of the "Energy-Aware" feature.