\n
## Bar Chart: Total Energy Consumption Comparison
### Overview
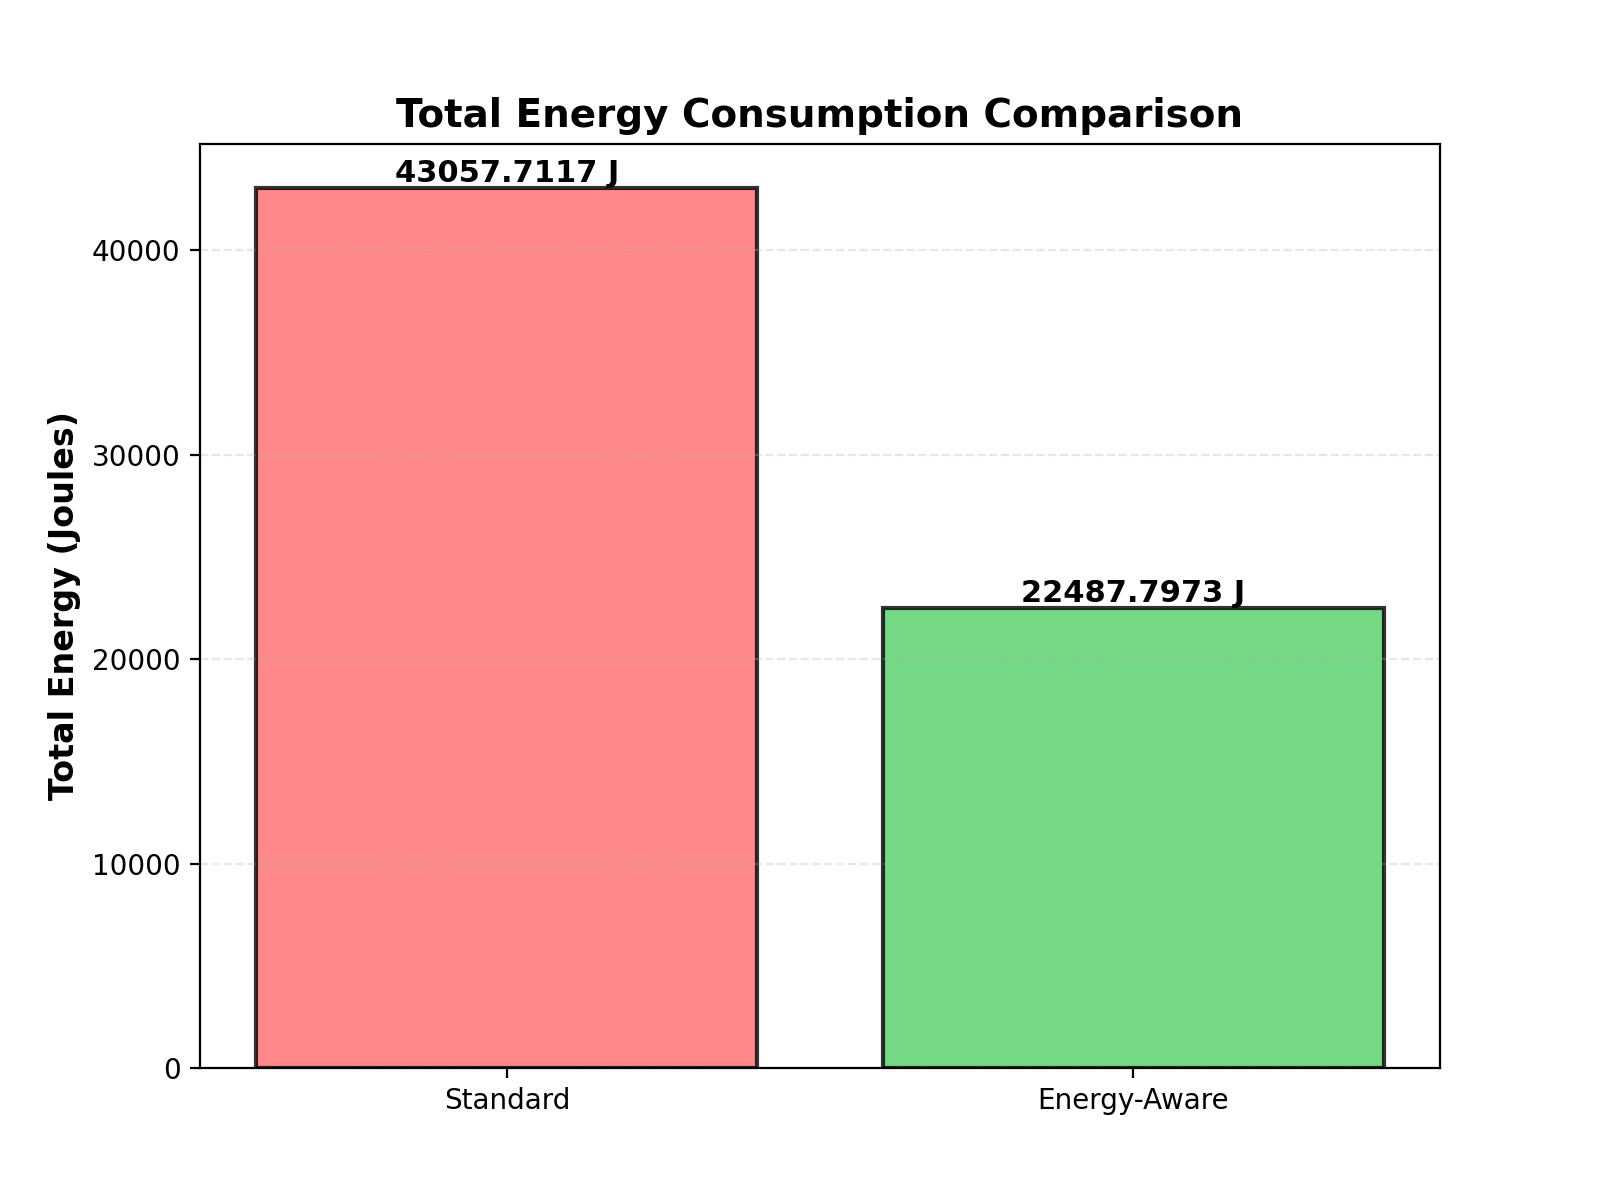
The image is a vertical bar chart comparing the total energy consumption, measured in Joules, between two distinct categories or methods: "Standard" and "Energy-Aware". The chart clearly demonstrates a significant difference in energy usage between the two.
### Components/Axes
* **Chart Title:** "Total Energy Consumption Comparison" (centered at the top).
* **Y-Axis:**
* **Label:** "Total Energy (Joules)" (rotated vertically on the left side).
* **Scale:** Linear scale ranging from 0 to over 40,000 Joules.
* **Major Tick Marks:** 0, 10000, 20000, 30000, 40000.
* **Grid Lines:** Horizontal, dashed, light gray grid lines extend from each major tick mark across the plot area.
* **X-Axis:**
* **Categories:** Two categorical bars are present.
* **Category Labels:** "Standard" (left bar) and "Energy-Aware" (right bar).
* **Data Series & Legend:** There is no separate legend. The categories are identified directly by their x-axis labels and distinct bar colors.
* **"Standard" Bar:** Positioned on the left. Color: Light pink/salmon with a black outline.
* **"Energy-Aware" Bar:** Positioned on the right. Color: Light green with a black outline.
### Detailed Analysis
* **"Standard" Category:**
* **Visual Trend:** This is the taller of the two bars, indicating higher energy consumption.
* **Exact Value:** The value is explicitly annotated at the top of the bar: **43057.7117 J**.
* **Spatial Grounding:** The bar originates from the x-axis at the "Standard" label and extends vertically to a height corresponding to approximately 43,058 on the y-axis scale.
* **"Energy-Aware" Category:**
* **Visual Trend:** This is the shorter bar, indicating lower energy consumption.
* **Exact Value:** The value is explicitly annotated at the top of the bar: **22487.7973 J**.
* **Spatial Grounding:** The bar originates from the x-axis at the "Energy-Aware" label and extends vertically to a height corresponding to approximately 22,488 on the y-axis scale.
### Key Observations
1. **Significant Reduction:** The "Energy-Aware" method consumes substantially less energy than the "Standard" method.
2. **Quantifiable Difference:** The absolute difference is 43057.7117 J - 22487.7973 J = **20569.9144 J**.
3. **Proportional Reduction:** The "Energy-Aware" method uses approximately 52.2% of the energy consumed by the "Standard" method (22487.7973 / 43057.7117 ≈ 0.522). This represents a reduction of about **47.8%**.
4. **Data Precision:** The values are reported to four decimal places, suggesting they are the result of precise measurement or calculation.
### Interpretation
This chart provides strong, quantitative evidence for the efficacy of an "Energy-Aware" approach compared to a "Standard" one. The data suggests that implementing energy-aware strategies or technologies can lead to a dramatic reduction in total energy consumption—nearly cutting it in half in this specific comparison.
The visual impact of the chart is immediate: the stark height difference between the pink and green bars communicates the core message of efficiency gain more powerfully than the numbers alone. The choice of colors (a warm, potentially "warning" color for high consumption and a cool, "positive" color for low consumption) subtly reinforces the narrative.
From a technical or engineering perspective, this result would be highly significant. It implies that the "Energy-Aware" system, algorithm, or process is far more efficient. The next logical questions would be: What specific changes constitute the "Energy-Aware" method? Over what operational period was this energy measured? Are there trade-offs in performance, cost, or complexity associated with achieving this energy saving? The chart successfully isolates and presents the key outcome—energy savings—prompting these deeper investigative questions.