## Bar Chart: Total Energy Consumption Comparison
### Overview
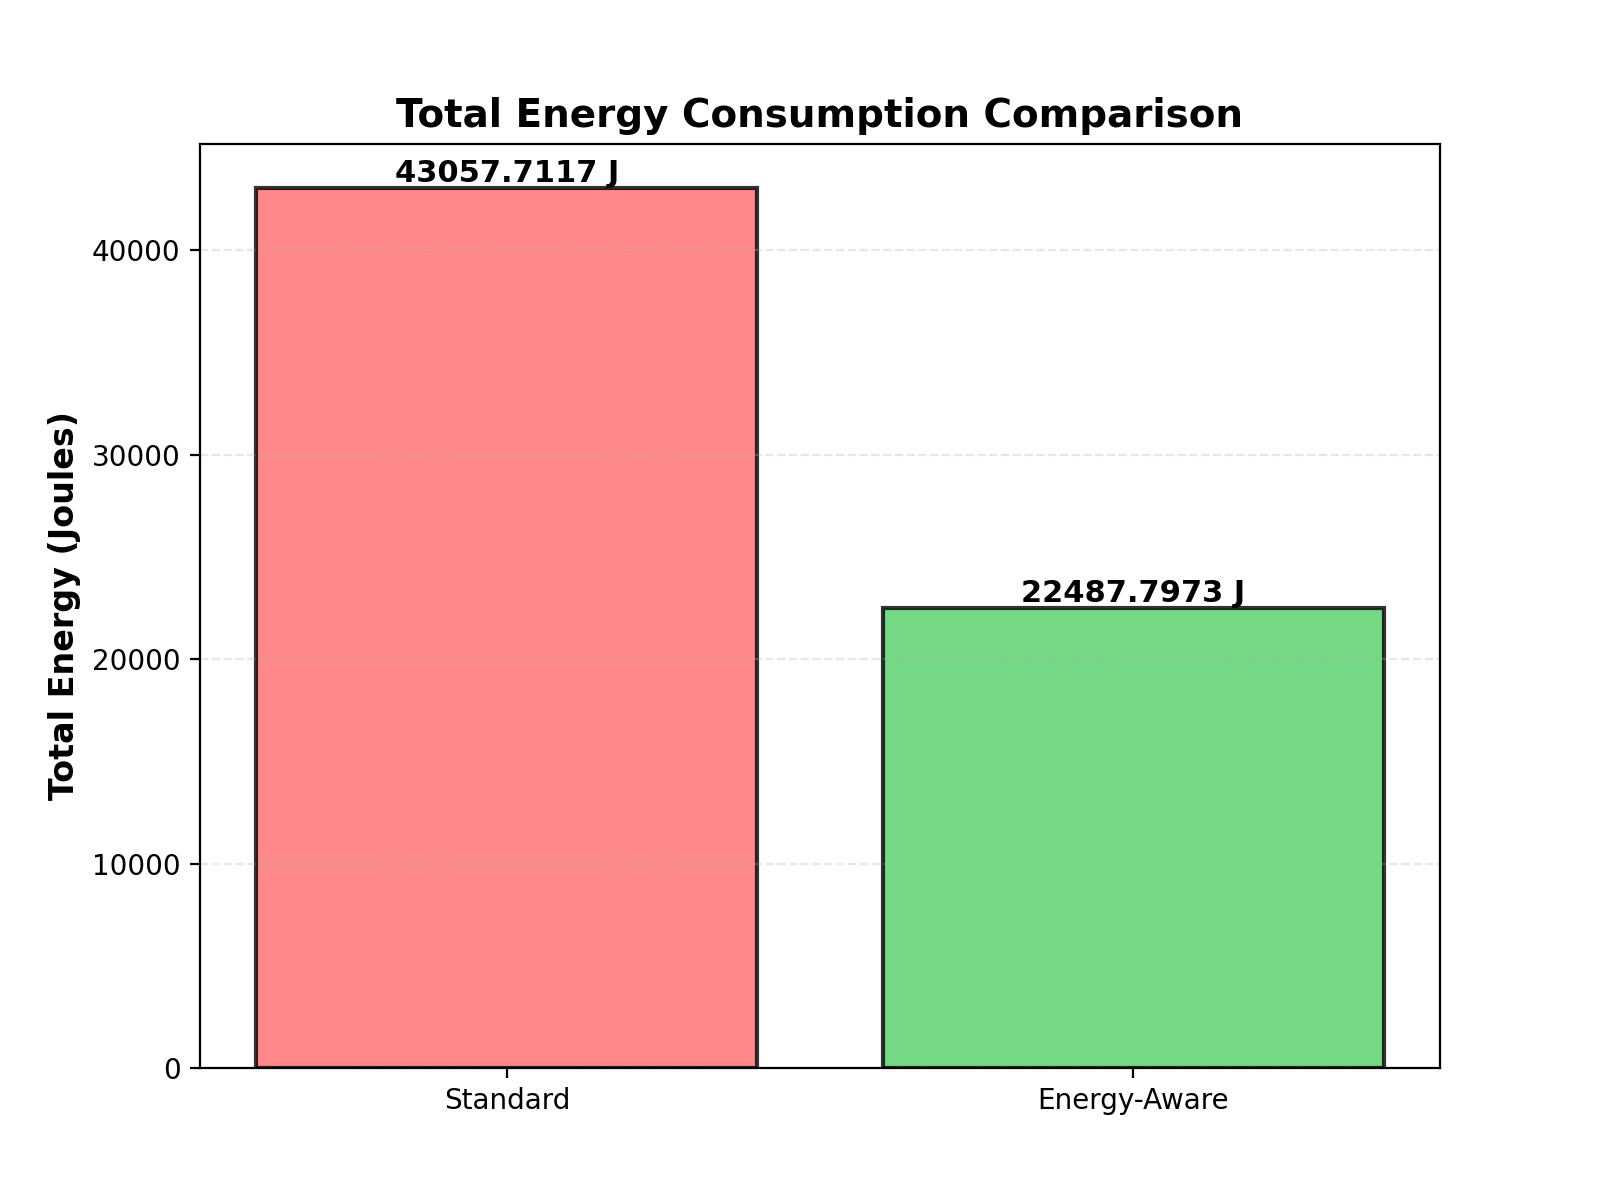
The chart compares total energy consumption (in Joules) between two systems: "Standard" and "Energy-Aware." The "Standard" system consumes significantly more energy than the "Energy-Aware" system, with values explicitly labeled on each bar.
### Components/Axes
- **X-axis**: Categories labeled "Standard" (left) and "Energy-Aware" (right).
- **Y-axis**: Labeled "Total Energy (Joules)" with a linear scale from 0 to 45,000 in increments of 5,000.
- **Legend**: Located at the bottom-right corner, associating red with "Standard" and green with "Energy-Aware."
- **Bars**:
- Red bar (Standard): 43,057.7117 J.
- Green bar (Energy-Aware): 22,487.7973 J.
### Detailed Analysis
- **Standard System**:
- Energy consumption: **43,057.7117 J** (exact value).
- Positioned at the leftmost bar, occupying ~80% of the y-axis range.
- **Energy-Aware System**:
- Energy consumption: **22,487.7973 J** (exact value).
- Positioned at the rightmost bar, occupying ~45% of the y-axis range.
- **Legend Alignment**: Colors match bar colors (red = Standard, green = Energy-Aware).
### Key Observations
1. The "Standard" system consumes **1.915 times more energy** than the "Energy-Aware" system.
2. The "Energy-Aware" system uses less than half the energy of the "Standard" system.
3. The y-axis scale accommodates both values, with the "Standard" bar nearly reaching the 45,000 J mark.
### Interpretation
The data demonstrates a stark efficiency disparity between the two systems. The "Energy-Aware" system reduces energy consumption by approximately **48%** compared to the "Standard" system. This suggests that the "Energy-Aware" design significantly optimizes energy usage, which could have critical implications for sustainability or cost-effectiveness in applications where energy consumption is a limiting factor. The precise numerical values indicate rigorous measurement, though the chart does not specify the context (e.g., time frame, operational conditions) for the energy readings.