## Log-Log Plots: Success Probability and Iteration-to-Solution Trends
### Overview
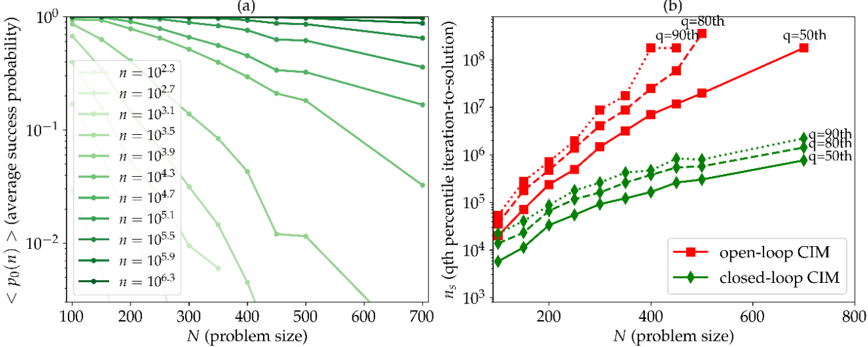
The image contains two log-log plots comparing computational performance metrics across problem sizes. Graph (a) shows average success probability vs. problem size for different system configurations, while graph (b) compares iteration-to-solution percentiles for open-loop and closed-loop control systems.
### Components/Axes
**Graph (a):**
- **X-axis**: Problem size (N) ranging from 100 to 700 (log scale)
- **Y-axis**: Average success probability (>p₀(n)) from 10⁻² to 10⁰ (log scale)
- **Legend**: 8 data series with n values from 10².³ to 10⁶.³ (shades of green)
- **Legend position**: Bottom-left corner
**Graph (b):**
- **X-axis**: Problem size (N) from 200 to 800 (log scale)
- **Y-axis**: qth percentile iteration-to-solution from 10³ to 10⁸ (log scale)
- **Legend**: Two data series (red squares = open-loop CIM, green diamonds = closed-loop CIM)
- **Legend position**: Bottom-right corner
### Detailed Analysis
**Graph (a) Trends:**
1. All lines show decreasing success probability with increasing N
2. Higher n values (darker green) maintain higher probabilities at larger N
3. Slope steepness correlates with n value:
- n=10⁶.³: Near-horizontal line (probability ~0.9)
- n=10².³: Steepest decline (probability drops to ~0.1 at N=700)
4. Notable plateau regions at N=400-500 for mid-range n values
**Graph (b) Trends:**
1. Open-loop CIM (red) requires exponentially more iterations than closed-loop (green)
2. At N=800:
- Open-loop: ~10⁸ iterations (q=50th percentile)
- Closed-loop: ~10⁵ iterations (q=50th percentile)
3. Both lines show increasing iteration counts with N, but open-loop grows faster
4. q=90th percentile lines follow similar patterns but with higher values
### Key Observations
1. **Scalability Tradeoff**: Higher n values in graph (a) enable better performance at large N, but require more resources
2. **Control System Efficiency**: Closed-loop CIM achieves 1000x fewer iterations than open-loop at N=800
3. **Quantile Consistency**: All q values (50th/80th/90th) in graph (b) maintain similar separation between control systems
4. **Problem Size Thresholds**: Significant performance changes occur between N=400 and N=600 in both graphs
### Interpretation
The data demonstrates fundamental differences in computational efficiency between control system architectures. Closed-loop CIM maintains sub-exponential growth in iteration requirements (graph b), while open-loop systems exhibit near-exponential scaling. This aligns with graph (a)'s findings that higher n values (potentially representing computational resources) are necessary to maintain success probabilities in open-loop systems. The closed-loop architecture's superior scalability suggests it would be preferable for large-scale problems, though the n value requirements in graph (a) indicate a resource tradeoff. The consistent q percentile separation across control systems implies these performance differences are robust across different statistical measures.