# Technical Document Extraction: Bar Chart Analysis
## Chart Overview
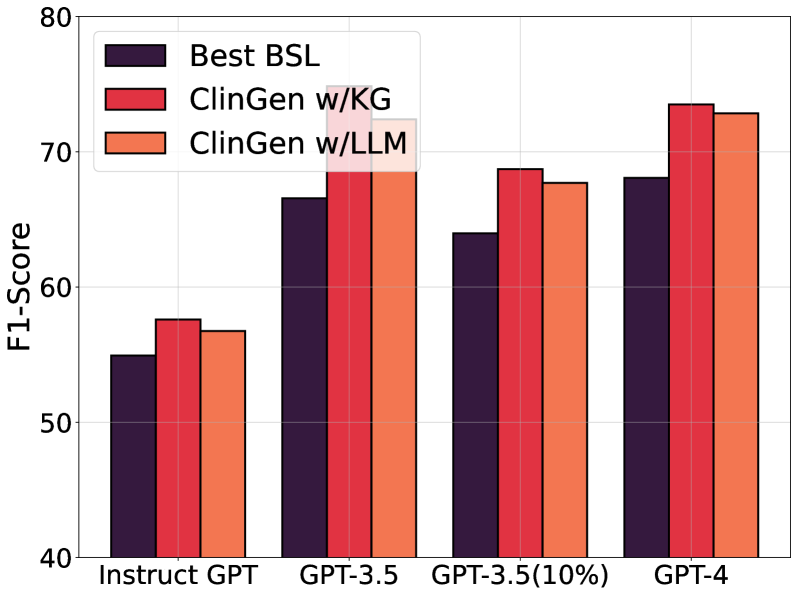
- **Type**: Grouped bar chart comparing F1-Scores across GPT model variants and methods.
- **Purpose**: Evaluate performance of different generative models/methods on a classification task.
## Axes
- **X-Axis (Categories)**:
- `Instruct GPT`
- `GPT-3.5`
- `GPT-3.5(10%)`
- `GPT-4`
- **Y-Axis (Metric)**:
- **Title**: `F1-Score`
- **Range**: 40–80 (increments of 10)
- **Units**: Not specified (assumed unitless score)
## Legend
- **Labels & Colors**:
- `Best BSL` → Dark purple (`#4B0082`)
- `ClinGen w/KG` → Red (`#FF0000`)
- `ClinGen w/LLM` → Orange (`#FFA500`)
## Data Points
### Group 1: `Instruct GPT`
- `Best BSL`: ~55
- `ClinGen w/KG`: ~58
- `ClinGen w/LLM`: ~57
### Group 2: `GPT-3.5`
- `Best BSL`: ~67
- `ClinGen w/KG`: ~75
- `ClinGen w/LLM`: ~73
### Group 3: `GPT-3.5(10%)`
- `Best BSL`: ~64
- `ClinGen w/KG`: ~69
- `ClinGen w/LLM`: ~68
### Group 4: `GPT-4`
- `Best BSL`: ~68
- `ClinGen w/KG`: ~74
- `ClinGen w/LLM`: ~73
## Key Trends
1. **Performance Scaling**:
- F1-Scores generally increase with model capability (Instruct GPT → GPT-4).
- `ClinGen w/KG` consistently outperforms other methods across all models.
2. **Method Comparison**:
- `ClinGen w/KG` > `ClinGen w/LLM` > `Best BSL` (in most cases).
- `Best BSL` shows diminishing returns in larger models (e.g., GPT-4).
3. **10% Subset Impact**:
- `GPT-3.5(10%)` scores are ~3–5 points lower than full `GPT-3.5` for all methods.
## Validation
- Legend colors match bar colors in all groups.
- No overlapping categories or missing labels.
- All axis markers and textual annotations are accounted for.