## Chart: Power Curve Comparison for Various Wind Turbines
### Overview
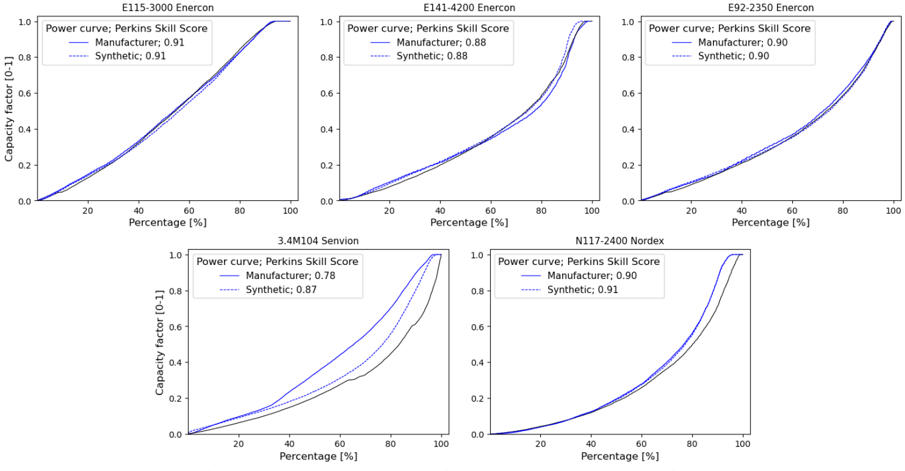
The image presents a series of five line charts, each comparing the power curve of a specific wind turbine model using both manufacturer data and synthetic data. The charts display the relationship between percentage (presumably of rated power or wind speed) on the x-axis and capacity factor (ranging from 0 to 1) on the y-axis. Each chart includes a legend indicating the Perkins Skill Score for both the manufacturer and synthetic power curves.
### Components/Axes
* **Titles:** Each chart has a title indicating the wind turbine model (e.g., "E115-3000 Enercon").
* **X-axis:** "Percentage [%]" ranging from 0 to 100 in increments of 20.
* **Y-axis:** "Capacity factor [0-1]" ranging from 0.0 to 1.0 in increments of 0.2.
* **Legend:** Located in the top-left corner of each chart.
* "Power curve; Perkins Skill Score"
* "Manufacturer": Solid blue line, with a Perkins Skill Score value.
* "Synthetic": Dashed blue line, with a Perkins Skill Score value.
### Detailed Analysis
**Chart 1: E115-3000 Enercon**
* Manufacturer (Solid Blue): The line starts at approximately (10, 0.02) and rises steadily, reaching approximately (100, 1.0).
* Synthetic (Dashed Blue): The line closely follows the manufacturer's line, starting at approximately (10, 0.02) and reaching approximately (100, 1.0).
* Perkins Skill Score: Manufacturer: 0.91, Synthetic: 0.91
**Chart 2: E141-4200 Enercon**
* Manufacturer (Solid Blue): The line starts at approximately (10, 0.01) and rises steadily, reaching approximately (100, 1.0).
* Synthetic (Dashed Blue): The line closely follows the manufacturer's line, starting at approximately (10, 0.01) and reaching approximately (100, 1.0).
* Perkins Skill Score: Manufacturer: 0.88, Synthetic: 0.88
**Chart 3: E92-2350 Enercon**
* Manufacturer (Solid Blue): The line starts at approximately (10, 0.01) and rises steadily, reaching approximately (100, 1.0).
* Synthetic (Dashed Blue): The line closely follows the manufacturer's line, starting at approximately (10, 0.01) and reaching approximately (100, 1.0).
* Perkins Skill Score: Manufacturer: 0.90, Synthetic: 0.90
**Chart 4: 3.4M104 Senvion**
* Manufacturer (Solid Black): The line starts at approximately (10, 0.01) and rises steadily, reaching approximately (100, 1.0).
* Synthetic (Dashed Blue): The line starts at approximately (10, 0.03) and rises steadily, but remains below the manufacturer's line, reaching approximately (100, 0.8).
* Perkins Skill Score: Manufacturer: 0.78, Synthetic: 0.87
**Chart 5: N117-2400 Nordex**
* Manufacturer (Solid Black): The line starts at approximately (10, 0.01) and rises steadily, reaching approximately (100, 1.0).
* Synthetic (Dashed Blue): The line closely follows the manufacturer's line, starting at approximately (10, 0.01) and reaching approximately (100, 1.0).
* Perkins Skill Score: Manufacturer: 0.90, Synthetic: 0.91
### Key Observations
* In most charts, the manufacturer and synthetic power curves are very similar, as indicated by the high Perkins Skill Scores.
* The 3.4M104 Senvion chart shows a noticeable difference between the manufacturer and synthetic power curves, with the synthetic curve underperforming compared to the manufacturer's data.
* The Perkins Skill Scores are generally high, indicating a good agreement between the manufacturer and synthetic power curves, except for the 3.4M104 Senvion model.
### Interpretation
The charts compare the power curves of different wind turbine models using manufacturer-provided data and synthetic data. The Perkins Skill Score quantifies the agreement between these two datasets. High scores indicate a strong correlation, suggesting that the synthetic data accurately represents the turbine's performance. The 3.4M104 Senvion model stands out as an exception, with a lower Perkins Skill Score and a visible divergence between the manufacturer and synthetic curves. This discrepancy could be due to various factors, such as differences in modeling assumptions, data quality, or operational conditions. The data suggests that the synthetic models are generally reliable for predicting the performance of these wind turbines, but careful attention should be paid to models with lower Perkins Skill Scores, such as the 3.4M104 Senvion.