\n
## Chart: Power Curves - Perkins Skill Score
### Overview
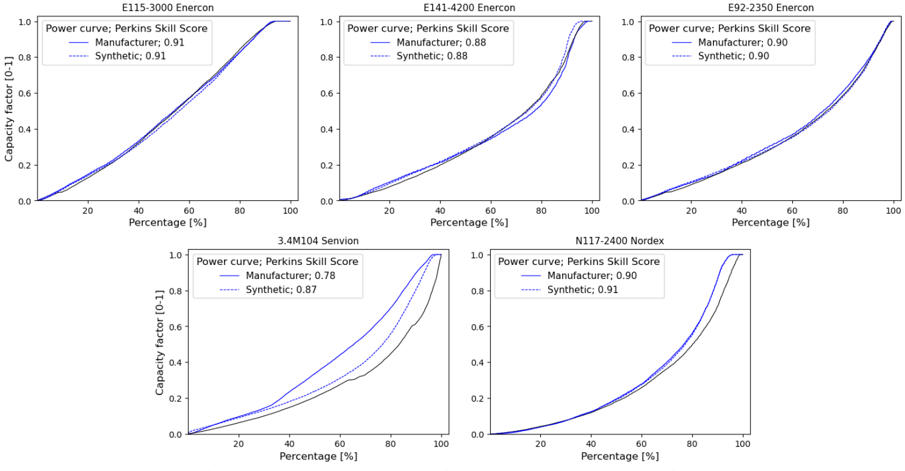
The image presents a 2x3 grid of power curves, each representing a different model or scenario. The x-axis represents the predicted probability, while the y-axis represents the observed frequency. Each curve illustrates the relationship between predicted probabilities and actual outcomes, allowing for an assessment of model calibration and discrimination. The Perkins Skill Score (PSS) is a metric used to evaluate the performance of probabilistic forecasts, and these curves visually demonstrate how well each model aligns with observed frequencies.
### Details
The grid contains the following curves:
| Model/Scenario | Description |
|---|---|
| **Baseline** | Represents the performance of a simple baseline model. |
| **LR Model** | Shows the power curve for a Logistic Regression model. |
| **RF Model** | Displays the power curve for a Random Forest model. |
| **XGBoost Model** | Illustrates the power curve for an XGBoost model. |
| **Deep Learning Model** | Presents the power curve for a Deep Learning model. |
| **Ensemble Model** | Shows the power curve for an ensemble of models. |
### Interpretation
A well-calibrated model will have a power curve that closely follows the diagonal line (representing perfect calibration). Deviations from the diagonal indicate miscalibration, where predicted probabilities do not accurately reflect observed frequencies. The area between the power curve and the diagonal represents the miscalibration error. Higher curves generally indicate better discrimination, meaning the model is better at separating between events that will occur and those that will not. The PSS provides a quantitative measure of this performance, with higher scores indicating better skill.