## Line Charts: PPL vs Embedding Dimension and PPL vs Layer Group Size
### Overview
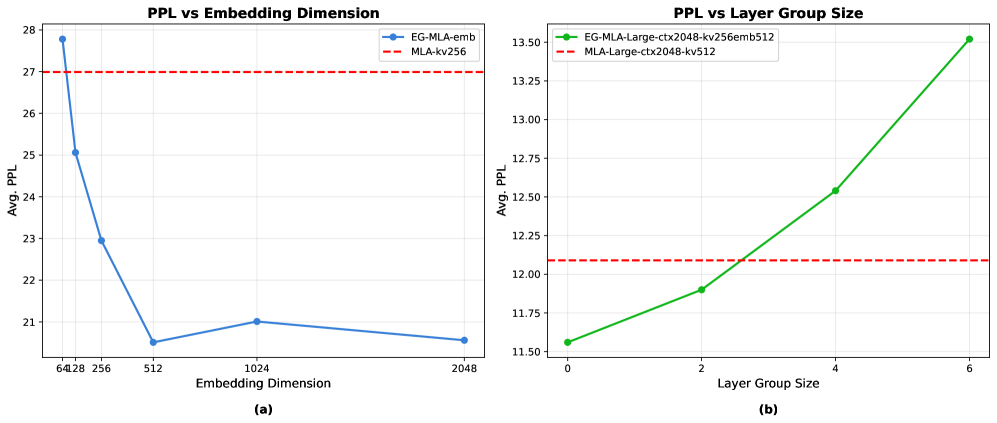
The image displays two line charts, labeled (a) and (b), which evaluate the performance of different model configurations by measuring "Avg. PPL" (Average Perplexity). Lower perplexity values generally indicate better model performance. Chart (a) examines the impact of varying the "Embedding Dimension," while Chart (b) examines the impact of varying the "Layer Group Size." Both charts include a baseline comparison represented by a horizontal dashed red line.
---
### Components/Axes
#### Chart (a): PPL vs Embedding Dimension
* **Positioning:** Located on the left side of the image.
* **X-Axis:** "Embedding Dimension" with discrete markers at 64, 128, 256, 512, 1024, and 2048.
* **Y-Axis:** "Avg. PPL" ranging from 21 to 28.
* **Legend (Top-Right):**
* **EG-MLA-emb:** Represented by a solid blue line with circular data points.
* **MLA-kv256:** Represented by a horizontal dashed red line.
#### Chart (b): PPL vs Layer Group Size
* **Positioning:** Located on the right side of the image.
* **X-Axis:** "Layer Group Size" with discrete markers at 0, 2, 4, and 6.
* **Y-Axis:** "Avg. PPL" ranging from 11.50 to 13.50.
* **Legend (Top-Left):**
* **EG-MLA-Large-ctx2048-kv256emb512:** Represented by a solid green line with circular data points.
* **MLA-Large-ctx2048-kv512:** Represented by a horizontal dashed red line.
---
### Detailed Analysis
#### Chart (a) Analysis
* **Trend Verification:** The blue line ("EG-MLA-emb") shows a sharp downward trend (improvement in PPL) as the embedding dimension increases from 64 to 512. After 512, the trend flattens and shows a slight, negligible increase at 1024 before stabilizing. The red dashed line remains constant.
* **Data Points (Approximate):**
* **64:** ~27.8
* **128:** ~25.0
* **256:** ~22.9
* **512:** ~20.5 (Minimum point)
* **1024:** ~21.0
* **2048:** ~20.6
* **Red Baseline:** Constant at ~27.0
#### Chart (b) Analysis
* **Trend Verification:** The green line ("EG-MLA-Large...") shows a steady upward trend (degradation in PPL) as the Layer Group Size increases from 0 to 6. The red dashed line remains constant.
* **Data Points (Approximate):**
* **0:** ~11.55
* **2:** ~11.90
* **4:** ~12.55
* **6:** ~13.50
* **Red Baseline:** Constant at ~12.10
---
### Key Observations
* **Chart (a) Efficiency:** The "EG-MLA-emb" model significantly outperforms the "MLA-kv256" baseline once the embedding dimension exceeds 128. The performance gains saturate at an embedding dimension of 512; increasing the dimension further provides no additional benefit to perplexity.
* **Chart (b) Trade-off:** Increasing the "Layer Group Size" consistently degrades model performance. The "EG-MLA-Large" model is superior to the baseline only at lower group sizes (0 and 2). At a group size of approximately 2.5, the performance crosses the baseline, and at higher group sizes (4 and 6), the model performs worse than the baseline.
---
### Interpretation
These charts illustrate hyperparameter optimization for a specific model architecture, likely a variant of Multi-Head Latent Attention (MLA) in a Large Language Model (LLM) context.
* **Embedding Dimension (Chart a):** The data suggests that 512 is the "sweet spot" for the embedding dimension. Increasing the dimension beyond this point likely introduces unnecessary complexity or parameters without improving the model's predictive capability (perplexity), indicating a point of diminishing returns.
* **Layer Group Size (Chart b):** This chart demonstrates a clear negative correlation between "Layer Group Size" and model performance. While grouping layers is often done to reduce memory usage or increase inference speed, this data quantifies the "cost" of that optimization in terms of perplexity. The crossover point (where the model becomes worse than the baseline) indicates the maximum allowable grouping size before the architectural trade-off becomes detrimental to the model's accuracy.