## Line Graphs: PPL vs Embedding Dimension and PPL vs Layer Group Size
### Overview
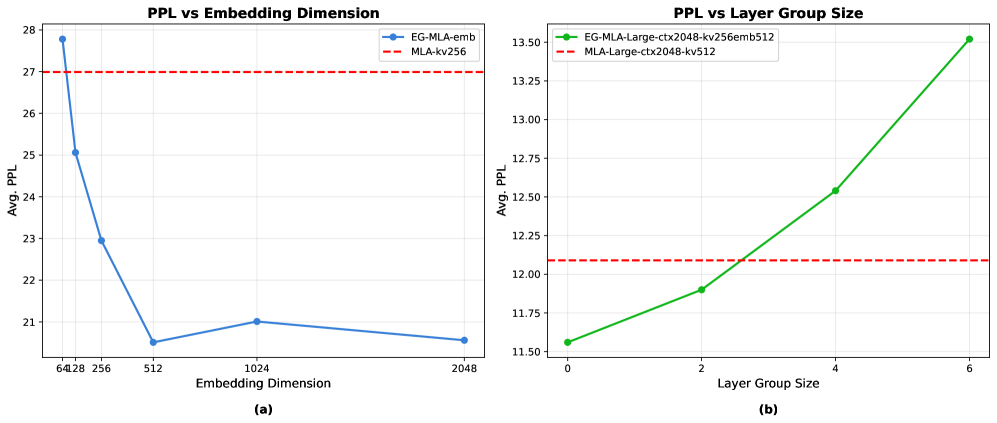
The image contains two line graphs comparing Perplexity (PPL) metrics across different model configurations. Graph (a) examines PPL relative to embedding dimensions, while graph (b) analyzes PPL against layer group sizes. Both graphs include baseline reference lines for comparison.
### Components/Axes
**Graph (a): PPL vs Embedding Dimension**
- **X-axis**: Embedding Dimension (values: 64, 128, 256, 512, 1024, 2048)
- **Y-axis**: Avg. PPL (range: 21–28)
- **Legend**:
- Blue line: "EG-MLA-emb"
- Red dashed line: "MLA-kv256"
**Graph (b): PPL vs Layer Group Size**
- **X-axis**: Layer Group Size (values: 0, 2, 4, 6)
- **Y-axis**: Avg. PPL (range: 11.5–13.5)
- **Legend**:
- Green line: "EG-MLA-Large-ctx2048-kv256emb512"
- Red dashed line: "MLA-Large-ctx2048-kv512"
### Detailed Analysis
**Graph (a) Trends**:
1. **EG-MLA-emb (blue line)**:
- Starts at ~27.8 PPL at 64 dimensions
- Sharp decline to ~25 PPL at 128 dimensions
- Further drop to ~23 PPL at 256 dimensions
- Slight increase to ~20.7 PPL at 512 dimensions
- Stabilizes at ~21 PPL at 1024 and 2048 dimensions
2. **MLA-kv256 (red dashed line)**: Constant at 27 PPL across all dimensions
**Graph (b) Trends**:
1. **EG-MLA-Large-ctx2048-kv256emb512 (green line)**:
- Starts at ~11.6 PPL at layer group size 0
- Increases to ~11.9 PPL at size 2
- Rises to ~12.5 PPL at size 4
- Peaks at ~13.5 PPL at size 6
2. **MLA-Large-ctx2048-kv512 (red dashed line)**: Constant at 12 PPL across all sizes
### Key Observations
1. **Embedding Dimension Impact**:
- PPL decreases significantly with increasing dimensions up to 256
- Diminishing returns observed beyond 256 dimensions
- EG-MLA-emb consistently outperforms MLA-kv256 baseline
2. **Layer Group Size Impact**:
- PPL increases linearly with larger layer groups
- EG-MLA-Large model shows 16.7% PPL increase from size 0 to 6
- MLA-Large baseline remains stable at 12 PPL
### Interpretation
The data suggests:
1. **Optimal Embedding Dimensions**:
- 256 dimensions appear to be the "sweet spot" for EG-MLA-emb, balancing PPL reduction and computational efficiency
- Beyond 256 dimensions, PPL improvements plateau while resource costs likely increase
2. **Layer Group Size Tradeoffs**:
- Larger layer groups (6 vs 0) result in 16.7% higher PPL for EG-MLA-Large
- This indicates potential overfitting or increased model complexity costs
- The stable MLA-Large baseline suggests architectural differences mitigate PPL growth
3. **Model Architecture Insights**:
- EG-MLA variants consistently outperform MLA baselines
- The "kv256" and "kv512" configurations show different scaling behaviors
- The "ctx2048" context length appears critical for maintaining PPL performance
These findings highlight the importance of balancing model complexity with PPL performance, suggesting that optimal configurations exist beyond simple "bigger is better" approaches.