## Grid Diagram: Numbered Cells
### Overview
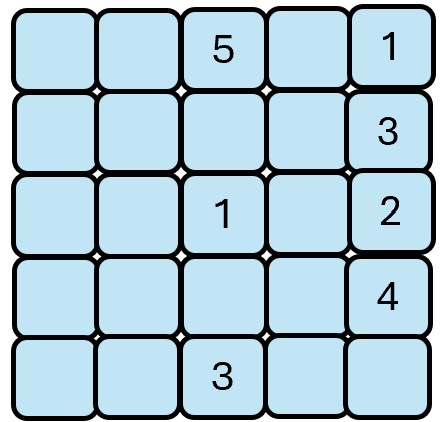
The image is a 5x5 grid of rounded squares. Most squares are light blue and empty, but some contain a single digit number. The numbers present are 1, 2, 3, 4, and 5.
### Components/Axes
* **Grid:** 5 rows and 5 columns.
* **Cells:** Each cell is a rounded square with a light blue fill and a black border.
* **Numbers:** Digits 1 through 5 are present in some cells.
### Detailed Analysis
The grid is structured as follows:
| | Column 1 | Column 2 | Column 3 | Column 4 | Column 5 |
| :---- | :------- | :------- | :------- | :------- | :------- |
| Row 1 | | | 5 | | 1 |
| Row 2 | | | | | 3 |
| Row 3 | | | 1 | | 2 |
| Row 4 | | | | | 4 |
| Row 5 | | | 3 | | |
Specifically:
* The cell in Row 1, Column 3 contains the number 5.
* The cell in Row 1, Column 5 contains the number 1.
* The cell in Row 2, Column 5 contains the number 3.
* The cell in Row 3, Column 3 contains the number 1.
* The cell in Row 3, Column 5 contains the number 2.
* The cell in Row 4, Column 5 contains the number 4.
* The cell in Row 5, Column 3 contains the number 3.
### Key Observations
* The numbers are only present in Columns 3 and 5.
* Column 1, 2, and 4 are empty.
* The numbers in Column 5 are in ascending order from top to bottom, excluding the first row.
* The numbers in Column 3 are 5, 1, 3 from top to bottom.
### Interpretation
The diagram appears to represent a sparse matrix or a visual representation of data points within a grid. The numbers could represent values, counts, or identifiers associated with specific locations in the grid. The pattern of numbered cells suggests a non-uniform distribution of data, with concentrations in Columns 3 and 5. The ascending order of numbers in Column 5 might indicate a sequential or hierarchical relationship.