## Grid Structure: 5x5 Matrix with Scattered Numerical Values
### Overview
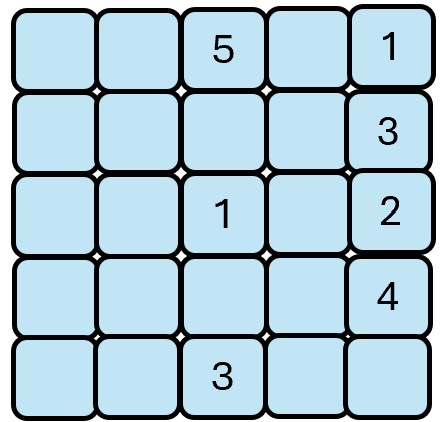
The image depicts a 5x5 grid composed of light blue cells outlined in black. Numerical values (1, 2, 3, 4, 5) are embedded in specific cells, while the majority remain empty. The grid lacks axis labels, legends, or explicit annotations beyond the embedded numbers.
### Components/Axes
- **Grid Structure**:
- 5 rows (top to bottom) and 5 columns (left to right).
- Cells are uniformly sized with rounded corners and black borders.
- **Numerical Values**:
- Values are centered within cells, using a bold, sans-serif font.
- No axis titles, legends, or color-coded data series are present.
### Detailed Analysis
- **Embedded Values**:
- **Row 1**:
- Column 3: `5`
- Column 5: `1`
- **Row 2**:
- Column 5: `3`
- **Row 3**:
- Column 3: `1`
- Column 5: `2`
- **Row 4**:
- Column 5: `4`
- **Row 5**:
- Column 3: `3`
- **Empty Cells**:
- 18/25 cells (72%) contain no text or symbols.
### Key Observations
1. **Duplicate Values**: The number `3` appears twice (Row 2, Column 5 and Row 5, Column 3), while all other values (`1`, `2`, `4`, `5`) appear once.
2. **Distribution Pattern**:
- Values are concentrated in the rightmost column (Columns 3 and 5) and the bottom row (Row 5).
- No clear numerical or positional sequence is evident.
3. **Ambiguity**: The purpose of the grid is unclear—it could represent a puzzle (e.g., Sudoku variant), a partially filled matrix, or a placeholder for data.
### Interpretation
- **Potential Use Cases**:
- The grid may be a fragment of a larger dataset, requiring additional context to interpret.
- The duplicate `3` suggests either an error or intentional design (e.g., a non-standard Sudoku rule).
- **Missing Information**:
- No axis labels or legends prevent direct interpretation of numerical significance (e.g., units, categories).
- The absence of a title or explanatory text leaves the grid’s purpose open to speculation.
- **Technical Implications**:
- If part of a larger system, this grid might require cross-referencing with external data sources to resolve ambiguities.
- The scattered values could indicate incomplete data entry or a deliberate sparse representation.
## Conclusion
The image provides limited actionable data due to its sparse structure and lack of contextual metadata. Further analysis would depend on additional information about the grid’s intended application or dataset origin.