# Technical Document Analysis: Diagram of Model Adaptation Strategies
## Axis Labels and Titles
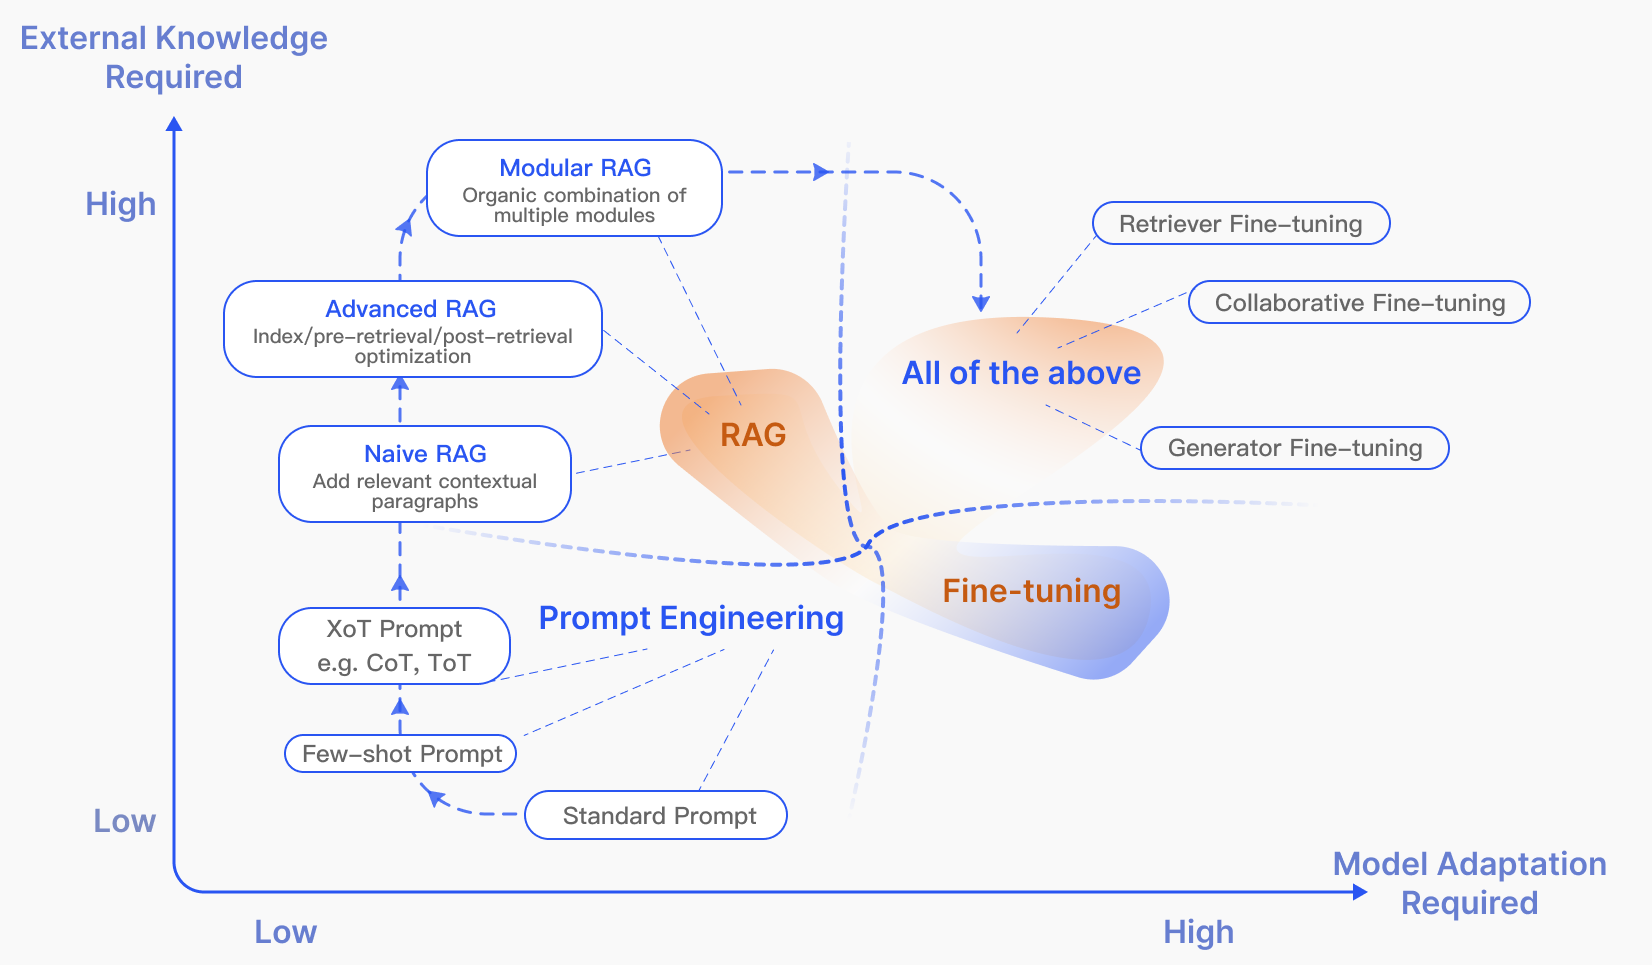
- **Vertical Axis**: "External Knowledge Required" (High to Low)
- **Horizontal Axis**: "Model Adaptation Required" (Low to High)
## Key Components and Flow
### 1. **Prompt Engineering** (Blue Region)
- **Sub-components**:
- Standard Prompt
- Few-shot Prompt
- XoT Prompt (e.g., CoT, ToT)
- Naive RAG (Add relevant contextual paragraphs)
- Advanced RAG (Index/pre-retrieval/post-retrieval optimization)
- Modular RAG (Organic combination of multiple modules)
- **Connections**:
- Dashed arrows link Prompt Engineering to RAG and Fine-tuning.
### 2. **RAG** (Orange Region)
- **Sub-components**:
- Naive RAG
- Advanced RAG
- Modular RAG
- **Connections**:
- Dashed arrows link RAG to Fine-tuning and Prompt Engineering.
### 3. **Fine-tuning** (Purple Region)
- **Sub-components**:
- Generator Fine-tuning
- Collaborative Fine-tuning
- Retriever Fine-tuning
- **Connections**:
- Dashed arrows link Fine-tuning to RAG and Prompt Engineering.
- Note: "All of the above" is explicitly labeled in the Fine-tuning region.
## Color Coding and Legend
- **Legend**: Implied by color coding (no explicit legend box visible).
- **Blue**: Prompt Engineering
- **Orange**: RAG
- **Purple**: Fine-tuning
- **Spatial Grounding**: Colors are spatially anchored to their respective regions.
## Diagram Structure
- **Regions**:
- **Header**: Axis titles and labels.
- **Main Chart**: Three interconnected regions (Prompt Engineering, RAG, Fine-tuning) with sub-components.
- **Footer**: No explicit footer; connections extend to axis boundaries.
## Textual Transcription
- **All Text Extracted**:
- "External Knowledge Required" (axis title)
- "Model Adaptation Required" (axis title)
- "High" and "Low" markers on axes.
- Sub-component labels (e.g., "Standard Prompt," "Generator Fine-tuning").
- Descriptive phrases (e.g., "Organic combination of multiple modules," "Add relevant contextual paragraphs").
- Note: "All of the above" in the Fine-tuning region.
## Observations
- **No Numerical Data**: The diagram is conceptual, not a chart with quantitative data.
- **Relationships**: Dashed arrows indicate interdependencies between strategies.
- **Color Consistency**: Colors align with regions (blue/orange/purple) and are spatially grounded.
## Conclusion
This diagram illustrates a framework for model adaptation strategies, emphasizing the interplay between Prompt Engineering, RAG, and Fine-tuning. It prioritizes textual components over numerical data, with color coding to differentiate regions.