## Line Chart: EGA vs. Episode
### Overview
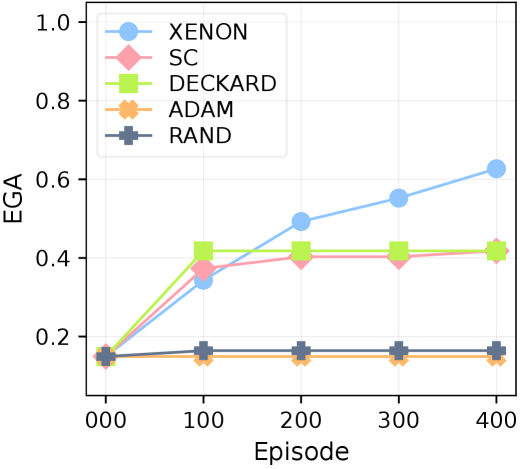
The image presents a line chart illustrating the relationship between "EGA" (y-axis) and "Episode" (x-axis) for five different entities: XENON, SC, DECKARD, ADAM, and RAND. The chart displays how the EGA value changes as the episode number increases from 0 to 400.
### Components/Axes
* **X-axis:** "Episode", ranging from 0 to 400, with markers at 0, 100, 200, 300, and 400.
* **Y-axis:** "EGA", ranging from 0 to 1.0, with markers at 0.0, 0.2, 0.4, 0.6, 0.8, and 1.0.
* **Legend:** Located in the top-left corner, identifying the five data series:
* XENON (Blue)
* SC (Pink/Red)
* DECKARD (Light Green)
* ADAM (Yellow/Orange)
* RAND (Dark Blue)
### Detailed Analysis
Here's a breakdown of each data series, including trend descriptions and approximate data points:
* **XENON (Blue):** The line slopes consistently upward.
* Episode 0: EGA ≈ 0.15
* Episode 100: EGA ≈ 0.35
* Episode 200: EGA ≈ 0.45
* Episode 300: EGA ≈ 0.55
* Episode 400: EGA ≈ 0.65
* **SC (Pink/Red):** The line initially rises sharply, then plateaus.
* Episode 0: EGA ≈ 0.15
* Episode 100: EGA ≈ 0.40
* Episode 200: EGA ≈ 0.42
* Episode 300: EGA ≈ 0.42
* Episode 400: EGA ≈ 0.42
* **DECKARD (Light Green):** The line rises initially, then plateaus.
* Episode 0: EGA ≈ 0.15
* Episode 100: EGA ≈ 0.42
* Episode 200: EGA ≈ 0.42
* Episode 300: EGA ≈ 0.42
* Episode 400: EGA ≈ 0.42
* **ADAM (Yellow/Orange):** The line remains relatively flat throughout.
* Episode 0: EGA ≈ 0.10
* Episode 100: EGA ≈ 0.12
* Episode 200: EGA ≈ 0.12
* Episode 300: EGA ≈ 0.12
* Episode 400: EGA ≈ 0.12
* **RAND (Dark Blue):** The line remains relatively flat throughout.
* Episode 0: EGA ≈ 0.15
* Episode 100: EGA ≈ 0.17
* Episode 200: EGA ≈ 0.17
* Episode 300: EGA ≈ 0.17
* Episode 400: EGA ≈ 0.17
### Key Observations
* XENON exhibits the most significant and consistent increase in EGA value over the episodes.
* SC and DECKARD show a rapid initial increase in EGA, followed by stabilization.
* ADAM and RAND demonstrate minimal change in EGA value across all episodes.
* ADAM consistently has the lowest EGA value.
### Interpretation
The chart suggests that the "EGA" metric is most sensitive to the "Episode" progression for the XENON entity. The rapid initial increase and subsequent plateau for SC and DECKARD could indicate a learning or adaptation phase followed by saturation. ADAM and RAND appear to be largely unaffected by the episode progression, potentially representing baseline or static behaviors. The EGA metric could represent a measure of performance, skill, or some other quantifiable attribute that evolves with experience (represented by the "Episode" number). The differences between the entities suggest varying rates of learning or adaptation. The fact that ADAM consistently has the lowest EGA value could indicate a fundamental difference in its capabilities or characteristics compared to the other entities. Further investigation would be needed to understand the specific meaning of "EGA" and the context of these entities and episodes.