## Line Chart: Algorithm Performance Over Episodes
### Overview
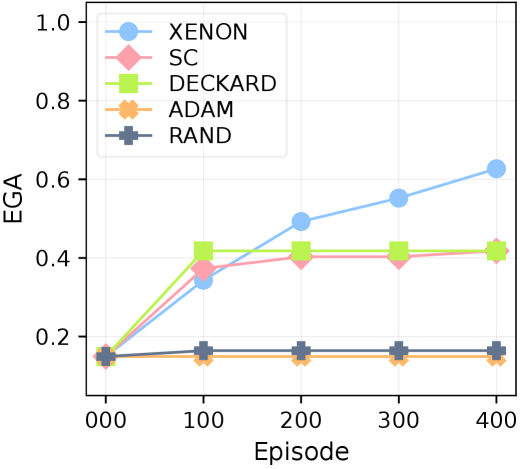
The image is a line chart comparing the performance of five algorithms (XENON, SC, DECKARD, ADAM, RAND) across 400 episodes, measured by EGA (Expected Goal Achievement). The y-axis ranges from 0.0 to 1.0, and the x-axis spans 0 to 400 episodes. The legend is positioned on the right, with distinct colors for each algorithm.
### Components/Axes
- **X-Axis**: Labeled "Episode," with increments at 0, 100, 200, 300, and 400.
- **Y-Axis**: Labeled "EGA," scaled from 0.0 to 1.0 in 0.2 increments.
- **Legend**: Located on the right, with the following mappings:
- **Blue**: XENON
- **Pink**: SC
- **Green**: DECKARD
- **Orange**: ADAM
- **Gray**: RAND
### Detailed Analysis
1. **XENON (Blue)**:
- Starts at ~0.15 EGA at 0 episodes.
- Increases steadily, reaching ~0.65 EGA by 400 episodes.
- Slope: Consistent upward trend with no plateaus.
2. **SC (Pink)**:
- Begins at ~0.15 EGA, rising to ~0.38 EGA by 100 episodes.
- Plateaus between 100 and 400 episodes (~0.38–0.42 EGA).
3. **DECKARD (Green)**:
- Starts at ~0.15 EGA, peaks at ~0.42 EGA by 100 episodes.
- Dips slightly (~0.38 EGA) by 200 episodes, then stabilizes.
4. **ADAM (Orange)**:
- Remains flat at ~0.15 EGA across all episodes.
5. **RAND (Gray)**:
- Starts at ~0.15 EGA, slightly increases to ~0.17 EGA by 400 episodes.
- Minimal upward trend compared to others.
### Key Observations
- **XENON** demonstrates the highest and most consistent growth in EGA.
- **SC** and **DECKARD** show mid-range performance, with SC plateauing earlier than DECKARD.
- **ADAM** and **RAND** exhibit negligible improvement, with RAND slightly outperforming ADAM by ~0.02 EGA at 400 episodes.
- **Crossing Point**: SC and DECKARD lines intersect near 100 episodes, with DECKARD briefly outperforming SC before both plateau.
### Interpretation
The data suggests **XENON** is the most effective algorithm for maximizing EGA over time, with a clear linear improvement. **SC** and **DECKARD** may employ different strategies, as evidenced by their divergent trajectories (SC’s early plateau vs. DECKARD’s delayed dip). **ADAM** and **RAND** likely represent baseline or random performance, with RAND showing marginally better results than ADAM. The lack of improvement in ADAM and RAND implies they may not adapt to increasing episode complexity. The crossing of SC and DECKARD lines highlights potential trade-offs in their design, warranting further investigation into their underlying mechanisms.