## Line Graph: Surprisal Across Layers for Different Steps
### Overview
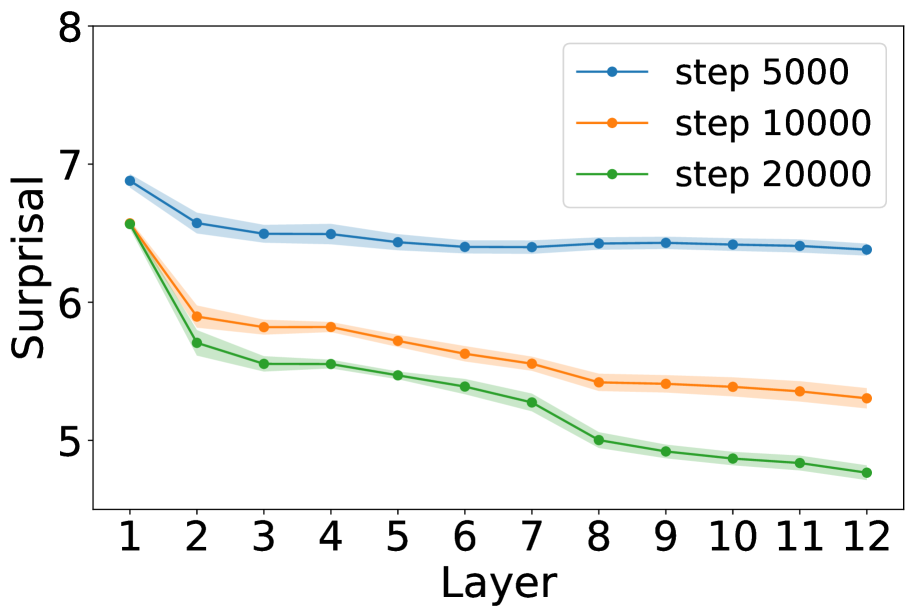
The graph depicts three descending lines representing "Surprisal" values across 12 layers for three distinct steps (5000, 10000, 20000). All lines show a general downward trend, with higher steps (numerically larger) associated with lower surprisal values. Shaded regions around each line indicate variability or confidence intervals.
### Components/Axes
- **X-axis (Layer)**: Labeled "Layer," with integer markers from 1 to 12.
- **Y-axis (Surprisal)**: Labeled "Surprisal," with a scale from 5 to 8.
- **Legend**: Located in the top-right corner, with three entries:
- Blue line: "step 5000"
- Orange line: "step 10000"
- Green line: "step 20000"
- **Lines**: Three distinct lines with markers (blue, orange, green) and shaded regions.
### Detailed Analysis
1. **Step 5000 (Blue Line)**:
- Starts at ~7.0 (Layer 1) and decreases gradually to ~6.5 (Layer 12).
- Shaded region narrows slightly, suggesting reduced variability at higher layers.
2. **Step 10000 (Orange Line)**:
- Begins at ~6.5 (Layer 1) and declines to ~5.3 (Layer 12).
- Shaded region widens initially, then stabilizes.
3. **Step 20000 (Green Line)**:
- Starts at ~6.5 (Layer 1) and drops sharply to ~4.8 (Layer 12).
- Shaded region is the widest, indicating higher uncertainty.
### Key Observations
- **Trend**: All lines decrease monotonically, with steeper declines for higher steps.
- **Divergence**: Step 20000 (green) diverges most sharply from the others, especially after Layer 6.
- **Variability**: Shaded regions suggest measurement noise or model uncertainty, with Step 20000 showing the greatest spread.
### Interpretation
The data suggests that increasing the "step" parameter (possibly iterations or data points) correlates with reduced surprisal, implying improved model predictability or stability. The sharpest decline in Step 20000 may indicate a threshold effect, where additional steps significantly refine the model's performance. The shaded regions highlight that higher steps (e.g., 20000) involve greater experimental or computational variability, possibly due to longer processing times or larger datasets. The consistent downward trend across all steps implies that the underlying process (e.g., neural network training, statistical modeling) becomes more deterministic with increased computational effort.