\n
## Line Chart: Surprisal vs. Layer for Different Training Steps
### Overview
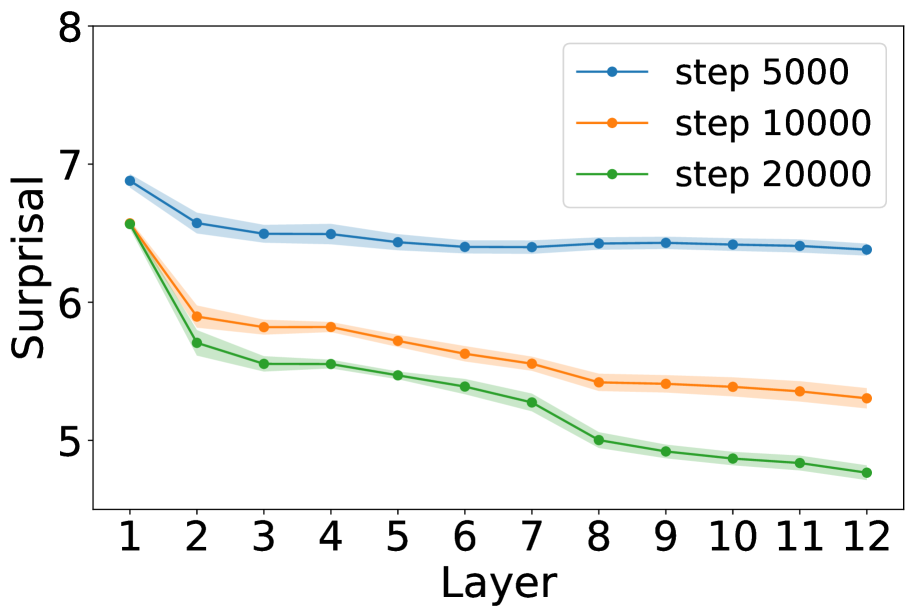
This line chart depicts the relationship between 'Surprisal' and 'Layer' for three different training steps: 5000, 10000, and 20000. The chart shows how surprisal changes across layers for each training step.
### Components/Axes
* **X-axis:** Layer, ranging from 1 to 12.
* **Y-axis:** Surprisal, ranging from approximately 4.8 to 7.2.
* **Legend:** Located in the top-right corner, with the following entries:
* Blue line: step 5000
* Orange line: step 10000
* Green line: step 20000
### Detailed Analysis
* **Step 5000 (Blue Line):** The line starts at approximately 6.8 at Layer 1 and gradually decreases to approximately 6.3 at Layer 2, then plateaus around 6.3-6.5 for layers 2 through 12.
* Layer 1: Surprisal ≈ 6.8
* Layer 2: Surprisal ≈ 6.3
* Layer 3: Surprisal ≈ 6.4
* Layer 4: Surprisal ≈ 6.4
* Layer 5: Surprisal ≈ 6.4
* Layer 6: Surprisal ≈ 6.4
* Layer 7: Surprisal ≈ 6.4
* Layer 8: Surprisal ≈ 6.4
* Layer 9: Surprisal ≈ 6.4
* Layer 10: Surprisal ≈ 6.4
* Layer 11: Surprisal ≈ 6.4
* Layer 12: Surprisal ≈ 6.4
* **Step 10000 (Orange Line):** The line begins at approximately 6.2 at Layer 1 and decreases to approximately 5.8 at Layer 2. It then continues to decrease, but at a slower rate, reaching approximately 5.4 at Layer 12.
* Layer 1: Surprisal ≈ 6.2
* Layer 2: Surprisal ≈ 5.8
* Layer 3: Surprisal ≈ 5.7
* Layer 4: Surprisal ≈ 5.6
* Layer 5: Surprisal ≈ 5.6
* Layer 6: Surprisal ≈ 5.5
* Layer 7: Surprisal ≈ 5.4
* Layer 8: Surprisal ≈ 5.3
* Layer 9: Surprisal ≈ 5.3
* Layer 10: Surprisal ≈ 5.3
* Layer 11: Surprisal ≈ 5.3
* Layer 12: Surprisal ≈ 5.4
* **Step 20000 (Green Line):** The line starts at approximately 5.9 at Layer 1 and decreases to approximately 5.5 at Layer 2. It continues to decrease, reaching approximately 4.9 at Layer 12.
* Layer 1: Surprisal ≈ 5.9
* Layer 2: Surprisal ≈ 5.5
* Layer 3: Surprisal ≈ 5.4
* Layer 4: Surprisal ≈ 5.3
* Layer 5: Surprisal ≈ 5.3
* Layer 6: Surprisal ≈ 5.2
* Layer 7: Surprisal ≈ 5.1
* Layer 8: Surprisal ≈ 5.0
* Layer 9: Surprisal ≈ 4.9
* Layer 10: Surprisal ≈ 4.9
* Layer 11: Surprisal ≈ 4.9
* Layer 12: Surprisal ≈ 4.9
### Key Observations
* All three lines exhibit a decreasing trend in surprisal as the layer number increases, indicating that the model becomes more confident in its predictions as it processes information through deeper layers.
* The rate of decrease in surprisal is most pronounced in the initial layers (1-3) for all training steps.
* The surprisal values are highest at step 5000 and decrease with increasing training steps (10000 and 20000). This suggests that the model is learning and reducing its uncertainty as it is trained further.
* The difference in surprisal between the training steps is more significant in the earlier layers.
### Interpretation
The chart demonstrates the effect of training on a model's surprisal across different layers. Surprisal, in this context, can be interpreted as a measure of how unexpected or uncertain the model is about its predictions. As the model is trained for more steps (from 5000 to 20000), the surprisal generally decreases, indicating that the model is becoming more confident and accurate in its predictions.
The decreasing trend across layers suggests that deeper layers of the model are better at capturing and representing the underlying patterns in the data. The initial rapid decrease in surprisal in the early layers could be due to the model learning basic features and representations. The subsequent slower decrease in later layers might indicate that the model is refining its understanding and making more subtle distinctions.
The fact that surprisal is higher at step 5000 compared to steps 10000 and 20000 suggests that the model is still actively learning and improving its performance with more training. The convergence of the lines at higher layers indicates that the model is approaching a state of stability, where further training may not lead to significant improvements in performance.