# Technical Document Extraction: Control Value Over Time
## Chart Title
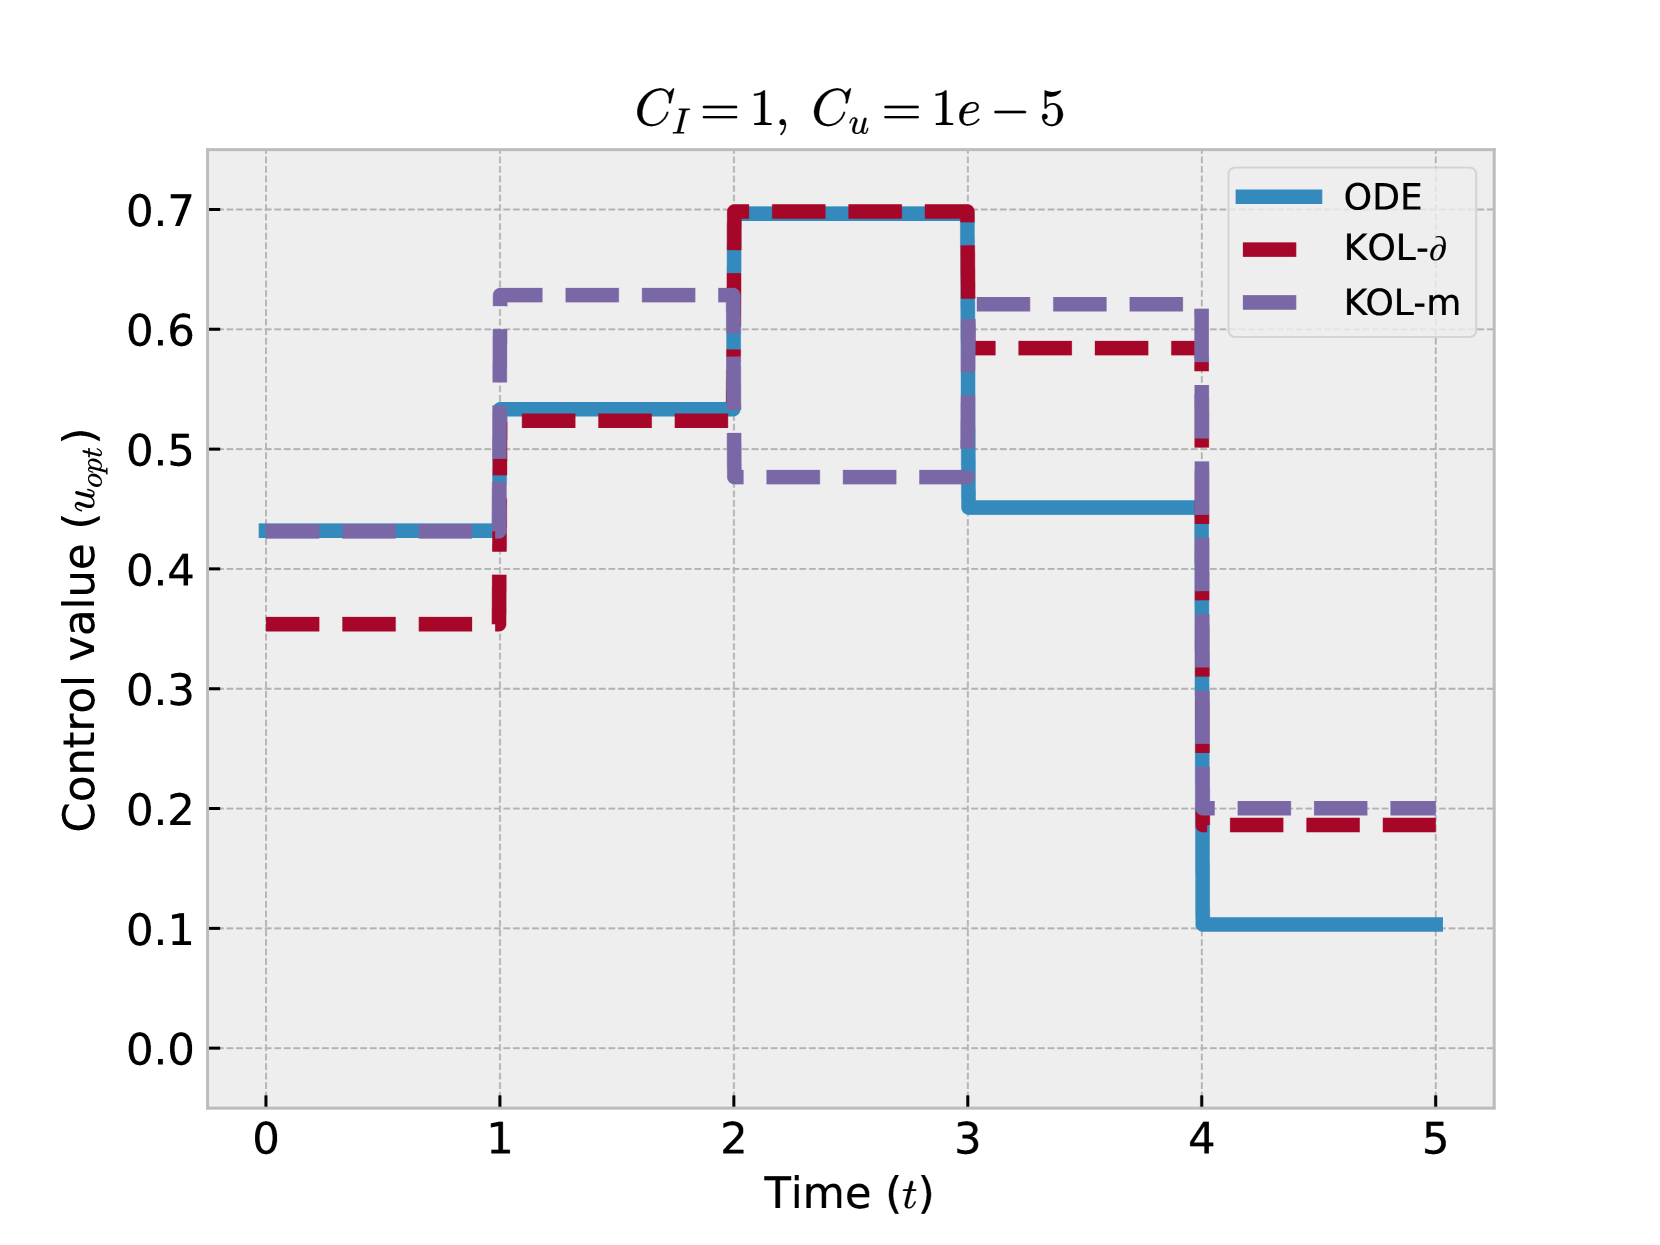
- **Title**: Control Value Over Time
- **Parameters**:
- \( C_I = 1 \)
- \( C_u = 1e-5 \)
## Axes
- **X-axis (Time, \( t \))**:
- Range: \( 0 \leq t \leq 5 \)
- Increment: 1 unit
- **Y-axis (Control Value, \( u_{opt} \))**:
- Range: \( 0.0 \leq u_{opt} \leq 0.7 \)
- Increment: 0.1 units
## Legend
| Color | Label |
|--------|-----------|
| Blue | ODE |
| Red | KOL-δ |
| Purple | KOL-m |
## Key Trends
1. **ODE (Blue Line)**:
- Initial value: \( 0.4 \) at \( t = 0 \)
- Step changes:
- \( t = 1 \): \( 0.5 \)
- \( t = 2 \): \( 0.7 \)
- \( t = 3 \): \( 0.4 \)
- \( t = 4 \): \( 0.1 \)
- Final value: \( 0.1 \) (held constant at \( t = 5 \))
2. **KOL-δ (Red Line)**:
- Initial value: \( 0.35 \) at \( t = 0 \)
- Step changes:
- \( t = 1 \): \( 0.5 \)
- \( t = 2 \): \( 0.6 \)
- \( t = 3 \): \( 0.5 \)
- \( t = 4 \): \( 0.2 \)
- Final value: \( 0.2 \) (held constant at \( t = 5 \))
3. **KOL-m (Purple Line)**:
- Initial value: \( 0.4 \) at \( t = 0 \)
- Step changes:
- \( t = 1 \): \( 0.6 \)
- \( t = 2 \): \( 0.5 \)
- \( t = 3 \): \( 0.6 \)
- \( t = 4 \): \( 0.2 \)
- Final value: \( 0.2 \) (held constant at \( t = 5 \))
## Observations
- All strategies exhibit stepwise control value adjustments at discrete time intervals.
- **ODE** shows the largest initial increase (from \( 0.4 \) to \( 0.7 \)) but ends with the lowest control value (\( 0.1 \)).
- **KOL-δ** and **KOL-m** converge to the same final control value (\( 0.2 \)) but differ in intermediate steps.
- **KOL-m** demonstrates the highest control value (\( 0.6 \)) at \( t = 1 \) and \( t = 3 \).
## Data Points Summary
| Time (\( t \)) | ODE (\( u_{opt} \)) | KOL-δ (\( u_{opt} \)) | KOL-m (\( u_{opt} \)) |
|----------------|---------------------|-----------------------|-----------------------|
| 0 | 0.4 | 0.35 | 0.4 |
| 1 | 0.5 | 0.5 | 0.6 |
| 2 | 0.7 | 0.6 | 0.5 |
| 3 | 0.4 | 0.5 | 0.6 |
| 4 | 0.1 | 0.2 | 0.2 |
| 5 | 0.1 | 0.2 | 0.2 |
## Notes
- The chart uses dashed lines for all strategies, with no intermediate smoothing.
- Control values are held constant between time steps (e.g., \( t = 0 \) to \( t = 1 \)).
- No overlapping data points occur between strategies at any time step.