## Model Prediction vs. Ground Truth Diagram
### Overview
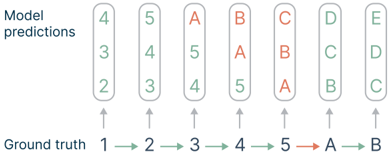
The image presents a diagram comparing model predictions against ground truth values. It illustrates how well a model's predictions align with the actual values across a sequence of inputs. The diagram uses numerical and alphabetical values to represent both the ground truth and the model's predictions.
### Components/Axes
* **Y-Axis (Implied):** Represents the range of possible predictions for each input.
* **X-Axis (Implied):** Represents the sequence of inputs, labeled as "Ground truth".
* **Model predictions:** Label indicating the predictions made by the model.
* **Ground truth:** Label indicating the actual values. The ground truth values are: 1, 2, 3, 4, 5, A, B.
* **Arrows:** Arrows point from the ground truth values to the corresponding model predictions.
* **Prediction Columns:** Each column above a ground truth value contains the model's predictions for that input.
### Detailed Analysis
The diagram shows the model's predictions for each ground truth value. The predictions are arranged in columns above each ground truth value. The predictions are either correct (green) or incorrect (red).
* **Ground Truth 1:** Model predicts 2, 3, 4 (all green, thus correct)
* **Ground Truth 2:** Model predicts 3, 4, 5 (all green, thus correct)
* **Ground Truth 3:** Model predicts 4, 5, A (A is red, thus incorrect)
* **Ground Truth 4:** Model predicts 5, A, B (A and B are red, thus incorrect)
* **Ground Truth 5:** Model predicts A, B, C (A, B, and C are red, thus incorrect)
* **Ground Truth A:** Model predicts B, C, D (all green, thus correct)
* **Ground Truth B:** Model predicts C, D, E (all green, thus correct)
### Key Observations
* The model's predictions are accurate for the first two numerical inputs (1 and 2) and the last two alphabetical inputs (A and B).
* The model struggles with the middle numerical inputs (3, 4, and 5), making incorrect predictions.
* The incorrect predictions are highlighted in red, while the correct predictions are in green.
### Interpretation
The diagram suggests that the model performs well on the extremes of the input sequence but struggles with the middle values. This could indicate a bias in the model's training data or a limitation in its ability to generalize across the entire input range. The transition from numerical to alphabetical inputs does not seem to be a factor, as the model performs well on both ends of the sequence. The red values indicate where the model's predictions deviate from the actual ground truth, highlighting areas for potential improvement.