## Line Chart: Cross Sections of Convex Function
### Overview
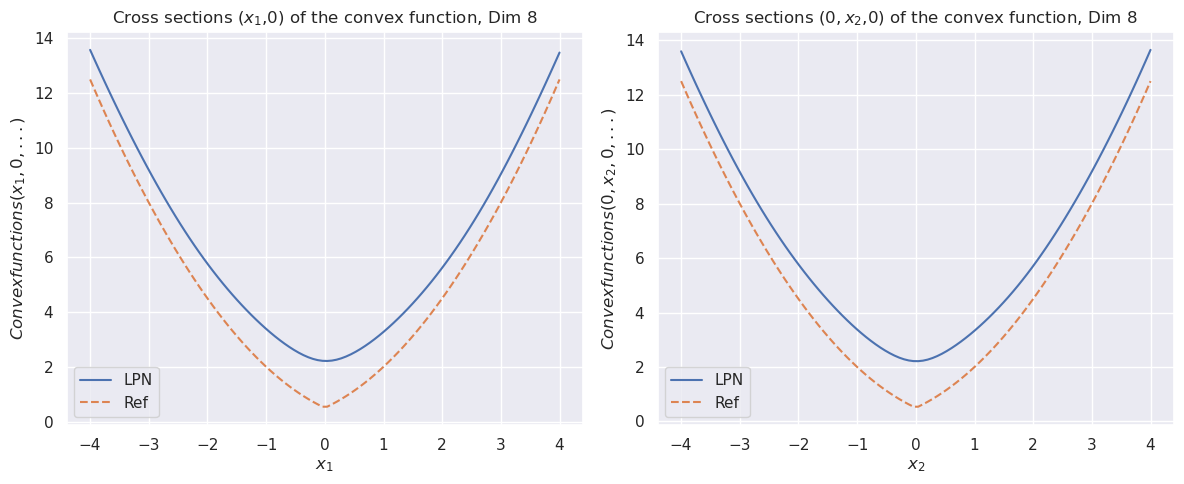
The image contains two line charts displayed side-by-side. Both charts depict cross-sections of a convex function in 8 dimensions. The left chart shows the cross-section (x1, 0), while the right chart shows the cross-section (0, x2, 0). Each chart plots two data series: "LPN" (solid blue line) and "Ref" (dashed orange line). Both charts show a U-shaped curve, indicating a convex function.
### Components/Axes
**Left Chart:**
* **Title:** Cross sections (x1,0) of the convex function, Dim 8
* **X-axis:** x1, ranging from -4 to 4 in increments of 1.
* **Y-axis:** Convexfunctions(x1, 0, ...), ranging from 0 to 14 in increments of 2.
* **Legend:** Located in the bottom-left corner.
* LPN: Solid blue line
* Ref: Dashed orange line
**Right Chart:**
* **Title:** Cross sections (0, x2,0) of the convex function, Dim 8
* **X-axis:** x2, ranging from -4 to 4 in increments of 1.
* **Y-axis:** Convexfunctions(0, x2, 0, ...), ranging from 0 to 14 in increments of 2.
* **Legend:** Located in the bottom-left corner.
* LPN: Solid blue line
* Ref: Dashed orange line
### Detailed Analysis
**Left Chart (x1, 0):**
* **LPN (Solid Blue):** The LPN line forms a U-shaped curve. It decreases from approximately 13.5 at x1 = -4 to a minimum of approximately 2.2 at x1 = 0, then increases back to approximately 13.5 at x1 = 4.
* x1 = -4, Convexfunctions(x1, 0, ...) ≈ 13.5
* x1 = -2, Convexfunctions(x1, 0, ...) ≈ 5
* x1 = 0, Convexfunctions(x1, 0, ...) ≈ 2.2
* x1 = 2, Convexfunctions(x1, 0, ...) ≈ 5
* x1 = 4, Convexfunctions(x1, 0, ...) ≈ 13.5
* **Ref (Dashed Orange):** The Ref line also forms a U-shaped curve, but with lower values than the LPN line. It decreases from approximately 12.5 at x1 = -4 to a minimum of approximately 0.5 at x1 = 0, then increases back to approximately 12.5 at x1 = 4.
* x1 = -4, Convexfunctions(x1, 0, ...) ≈ 12.5
* x1 = -2, Convexfunctions(x1, 0, ...) ≈ 3
* x1 = 0, Convexfunctions(x1, 0, ...) ≈ 0.5
* x1 = 2, Convexfunctions(x1, 0, ...) ≈ 3
* x1 = 4, Convexfunctions(x1, 0, ...) ≈ 12.5
**Right Chart (0, x2, 0):**
* **LPN (Solid Blue):** The LPN line forms a U-shaped curve. It decreases from approximately 13.5 at x2 = -4 to a minimum of approximately 2.2 at x2 = 0, then increases back to approximately 13.5 at x2 = 4.
* x2 = -4, Convexfunctions(0, x2, 0, ...) ≈ 13.5
* x2 = -2, Convexfunctions(0, x2, 0, ...) ≈ 5
* x2 = 0, Convexfunctions(0, x2, 0, ...) ≈ 2.2
* x2 = 2, Convexfunctions(0, x2, 0, ...) ≈ 5
* x2 = 4, Convexfunctions(0, x2, 0, ...) ≈ 13.5
* **Ref (Dashed Orange):** The Ref line also forms a U-shaped curve, but with lower values than the LPN line. It decreases from approximately 12.5 at x2 = -4 to a minimum of approximately 0.5 at x2 = 0, then increases back to approximately 12.5 at x2 = 4.
* x2 = -4, Convexfunctions(0, x2, 0, ...) ≈ 12.5
* x2 = -2, Convexfunctions(0, x2, 0, ...) ≈ 3
* x2 = 0, Convexfunctions(0, x2, 0, ...) ≈ 0.5
* x2 = 2, Convexfunctions(0, x2, 0, ...) ≈ 3
* x2 = 4, Convexfunctions(0, x2, 0, ...) ≈ 12.5
### Key Observations
* Both charts exhibit similar U-shaped curves for both LPN and Ref data series, indicating symmetry around x1 = 0 and x2 = 0.
* The LPN line consistently has higher values than the Ref line across the entire range of x1 and x2.
* The minimum value for both LPN and Ref occurs at x1 = 0 and x2 = 0.
### Interpretation
The charts illustrate the cross-sections of a convex function in 8 dimensions, specifically along the x1 and x2 axes while holding other dimensions at 0. The "LPN" and "Ref" likely represent two different methods or models for approximating or representing this convex function. The fact that both lines show a U-shape confirms the convexity along these cross-sections. The difference in magnitude between the LPN and Ref lines suggests that they have different scales or sensitivities to changes in x1 and x2. The Ref data series has a lower value than the LPN data series, suggesting that the "Ref" method results in a smaller value of the convex function compared to the "LPN" method. The symmetry of the curves around x=0 indicates that the function behaves similarly for positive and negative values of x1 and x2.