## Chart: Cross Sections of a Convex Function (Dim 8)
### Overview
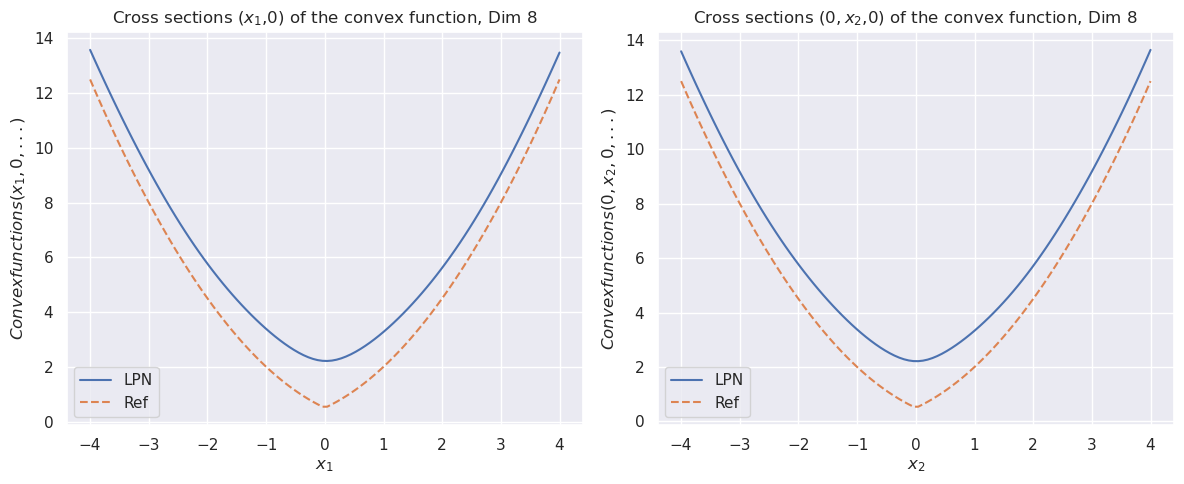
The image presents two separate line charts, both depicting cross-sections of a convex function in 8 dimensions. The first chart shows the cross-section along the x1-axis (with x2=0), and the second shows the cross-section along the x2-axis (with x1=0). Both charts compare two data series: "LPN" (solid blue line) and "Ref" (dashed orange line). The charts share identical y-axis scales and x-axis ranges.
### Components/Axes
* **X-axis (Left Chart):** Labeled "x1", ranging from approximately -4 to 4. Gridlines are present.
* **X-axis (Right Chart):** Labeled "x2", ranging from approximately -4 to 4. Gridlines are present.
* **Y-axis (Both Charts):** Labeled "Convex functions (x1, 0, ...)" for the left chart and "Convex functions (0, x2, 0)" for the right chart, ranging from 0 to 14. Gridlines are present.
* **Legend (Both Charts):** Located in the top-left corner.
* "LPN" - Represented by a solid blue line.
* "Ref" - Represented by a dashed orange line.
### Detailed Analysis or Content Details
**Left Chart (x1 Cross-Section):**
* **LPN (Blue Line):** The line exhibits a U-shaped curve, indicating a convex function. It reaches a minimum value around x1 = 0.
* Approximate data points:
* x1 = -4: y ≈ 13.5
* x1 = -2: y ≈ 6.5
* x1 = 0: y ≈ 2.0
* x1 = 2: y ≈ 6.5
* x1 = 4: y ≈ 13.5
* **Ref (Orange Line):** Also a U-shaped curve, but shifted upwards and slightly wider than the LPN line.
* Approximate data points:
* x1 = -4: y ≈ 12.0
* x1 = -2: y ≈ 5.0
* x1 = 0: y ≈ 2.5
* x1 = 2: y ≈ 5.0
* x1 = 4: y ≈ 12.0
**Right Chart (x2 Cross-Section):**
* **LPN (Blue Line):** Similar U-shaped curve to the left chart, with a minimum around x2 = 0.
* Approximate data points:
* x2 = -4: y ≈ 13.5
* x2 = -2: y ≈ 6.5
* x2 = 0: y ≈ 2.0
* x2 = 2: y ≈ 6.5
* x2 = 4: y ≈ 13.5
* **Ref (Orange Line):** Also a U-shaped curve, shifted upwards and slightly wider than the LPN line.
* Approximate data points:
* x2 = -4: y ≈ 12.0
* x2 = -2: y ≈ 5.0
* x2 = 0: y ≈ 2.5
* x2 = 2: y ≈ 5.0
* x2 = 4: y ≈ 12.0
### Key Observations
* Both charts exhibit similar behavior, suggesting symmetry in the convex function with respect to the x1 and x2 axes.
* The "Ref" line consistently has higher y-values than the "LPN" line across the entire range of x1 and x2, indicating that the "Ref" function is generally larger than the "LPN" function.
* The minimum values of both functions occur at x1 = 0 and x2 = 0, respectively.
* The shape of the curves is consistent with a quadratic function, which is a common form for convex functions.
### Interpretation
The charts demonstrate cross-sectional views of a convex function in an 8-dimensional space. The "LPN" and "Ref" lines likely represent two different approximations or variations of the same underlying convex function. The consistent offset between the two lines suggests that "Ref" might be a regularized or smoothed version of "LPN," or perhaps a different method of calculating the convex function. The symmetry observed in the cross-sections indicates that the function is likely independent of the other dimensions when considering only x1 or x2. The fact that both curves are convex (U-shaped) confirms that the function being analyzed is indeed convex. The data suggests that the function is minimized at the origin (x1=0, x2=0) in these cross-sections. The charts provide a visual comparison of the two functions along these specific axes, allowing for an assessment of their relative values and shapes.