## Cross-Sectional Analysis of a Convex Function in 8 Dimensions
### Overview
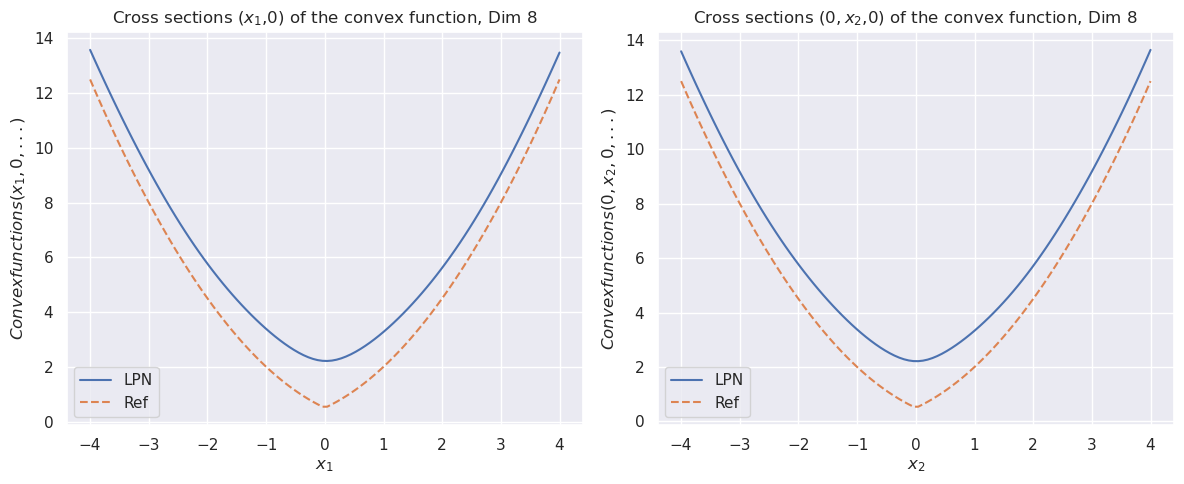
The image displays two side-by-side line charts, each showing a cross-sectional view of a convex function in an 8-dimensional space. The left chart plots the function's value along the first dimension (`x₁`), while the right chart plots it along the second dimension (`x₂`). Both charts compare two different functions or models: "LPN" (solid blue line) and "Ref" (dashed orange line).
### Components/Axes
**Common Elements (Both Charts):**
* **Chart Type:** Line chart with two data series.
* **Legend:** Located in the bottom-left corner of each plot area.
* **LPN:** Solid blue line.
* **Ref:** Dashed orange line.
* **Y-Axis:**
* **Label:** `Convexfunctions(x₁, 0, ...)` (left chart) and `Convexfunctions(0, x₂, 0, ...)` (right chart). The ellipses (`...`) indicate the function depends on additional dimensions not being varied in the cross-section.
* **Scale:** Linear, ranging from 0 to 14. Major tick marks are at intervals of 2 (0, 2, 4, 6, 8, 10, 12, 14).
* **Grid:** A light gray grid is present in the background of both plots.
**Left Chart Specifics:**
* **Title:** `Cross sections (x₁,0) of the convex function, Dim 8`
* **X-Axis:**
* **Label:** `x₁`
* **Scale:** Linear, ranging from -4 to 4. Major tick marks are at integer intervals (-4, -3, -2, -1, 0, 1, 2, 3, 4).
**Right Chart Specifics:**
* **Title:** `Cross sections (0, x₂,0) of the convex function, Dim 8`
* **X-Axis:**
* **Label:** `x₂`
* **Scale:** Linear, ranging from -4 to 4. Major tick marks are at integer intervals (-4, -3, -2, -1, 0, 1, 2, 3, 4).
### Detailed Analysis
**Left Chart (Varying `x₁`):**
* **Trend Verification:** Both the LPN and Ref lines form symmetric, upward-opening parabolas centered at `x₁ = 0`. The Ref line has a sharper, more pronounced minimum.
* **LPN (Solid Blue Line) Data Points (Approximate):**
* At `x₁ = -4`: y ≈ 13.5
* At `x₁ = -2`: y ≈ 6.0
* At `x₁ = 0` (Minimum): y ≈ 2.2
* At `x₁ = 2`: y ≈ 6.0
* At `x₁ = 4`: y ≈ 13.5
* **Ref (Dashed Orange Line) Data Points (Approximate):**
* At `x₁ = -4`: y ≈ 12.5
* At `x₁ = -2`: y ≈ 4.0
* At `x₁ = 0` (Minimum): y ≈ 0.5
* At `x₁ = 2`: y ≈ 4.0
* At `x₁ = 4`: y ≈ 12.5
**Right Chart (Varying `x₂`):**
* **Trend Verification:** The trends are visually identical to the left chart. Both lines form symmetric parabolas centered at `x₂ = 0`, with the Ref line having a sharper minimum.
* **LPN (Solid Blue Line) Data Points (Approximate):**
* At `x₂ = -4`: y ≈ 13.5
* At `x₂ = -2`: y ≈ 6.0
* At `x₂ = 0` (Minimum): y ≈ 2.2
* At `x₂ = 2`: y ≈ 6.0
* At `x₂ = 4`: y ≈ 13.5
* **Ref (Dashed Orange Line) Data Points (Approximate):**
* At `x₂ = -4`: y ≈ 12.5
* At `x₂ = -2`: y ≈ 4.0
* At `x₂ = 0` (Minimum): y ≈ 0.5
* At `x₂ = 2`: y ≈ 4.0
* At `x₂ = 4`: y ≈ 12.5
### Key Observations
1. **Symmetry:** Both functions (LPN and Ref) are symmetric about the origin (`x=0`) in both cross-sections.
2. **Convexity:** Both functions are convex, as evidenced by their upward-curving, parabolic shape.
3. **Minimum Value Discrepancy:** The "Ref" function has a significantly lower minimum value (≈0.5) compared to the "LPN" function (≈2.2) at the center of the cross-section (`x=0`).
4. **Growth Rate:** The "Ref" function grows more steeply away from the minimum than the "LPN" function. This is visible in the steeper slopes of the dashed orange line.
5. **Identical Behavior:** The cross-sectional behavior along `x₁` and `x₂` is virtually identical for both functions, suggesting a high degree of symmetry in the full 8-dimensional function.
### Interpretation
This visualization compares the cross-sectional profiles of two convex functions, likely a learned model ("LPN") and a reference or ground-truth function ("Ref"), in an 8-dimensional space.
* **What the data suggests:** The "LPN" model successfully captures the overall convex shape and symmetry of the reference function. However, it does not perfectly match the reference. The key differences are:
* **Offset Minimum:** The LPN model's minimum is higher than the reference's, indicating a systematic bias or offset at the function's lowest point.
* **Curvature Difference:** The LPN model has a slightly broader, less steep curvature. This suggests it may be a smoothed or regularized approximation of the sharper reference function.
* **How elements relate:** The side-by-side comparison of two different cross-sections (`x₁` and `x₂`) is used to demonstrate that the observed relationship between LPN and Ref is consistent across different dimensions, reinforcing the conclusion that the differences are characteristic of the model's approximation, not an artifact of a single slice.
* **Notable Anomalies:** There are no outliers in the traditional sense, as the curves are smooth. The primary "anomaly" is the consistent vertical offset and curvature difference between the two models, which is the central finding of the visualization. This is a common pattern in machine learning, where a trained model (LPN) approximates but does not perfectly replicate a target function (Ref).