## Line Graphs: Cross Sections of Convex Function in 8D Space
### Overview
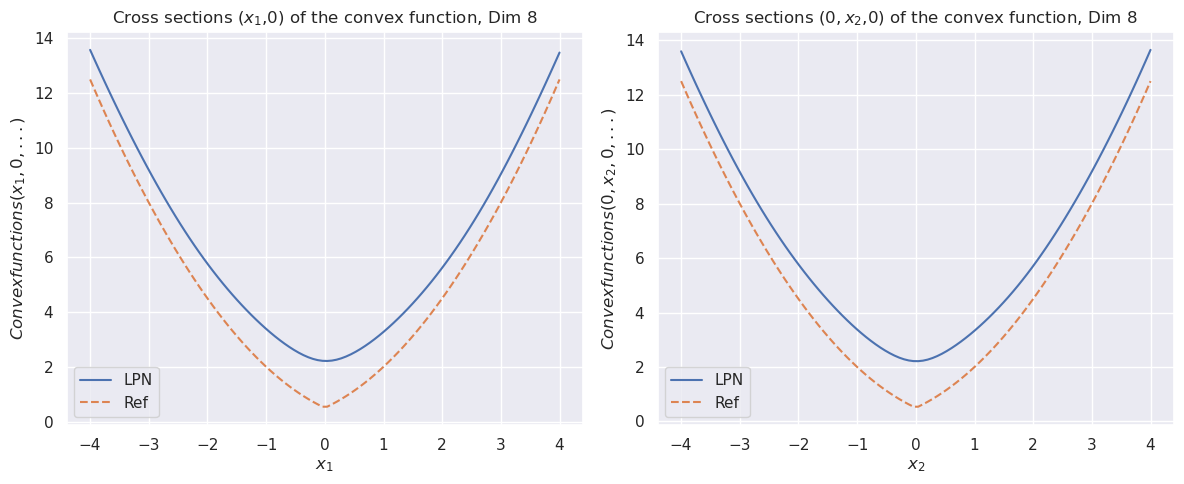
The image contains two identical line graphs comparing two mathematical models ("LPN" and "Ref") for convex functions in 8-dimensional space. Both graphs show cross-sectional behavior along principal axes (x₁ and x₂), with identical scaling and structure. The graphs emphasize differences in curvature and minima between the two models.
### Components/Axes
- **Left Graph**:
- Title: "Cross sections (x₁,0) of the convex function, Dim 8"
- X-axis: Labeled "x₁" with range [-4, 4]
- Y-axis: Labeled "Convexfunctions(x₁,0, ...)" with range [0, 14]
- Legend: "LPN" (solid blue line), "Ref" (dashed orange line)
- **Right Graph**:
- Title: "Cross sections (0,x₂,0) of the convex function, Dim 8"
- X-axis: Labeled "x₂" with range [-4, 4]
- Y-axis: Labeled "Convexfunctions(0,x₂,0, ...)" with range [0, 14]
- Legend: Same as left graph
### Detailed Analysis
#### Left Graph (x₁-axis)
- **LPN Line (solid blue)**:
- Minimum value ≈ 2 at x₁ = 0
- Peaks ≈ 13.5 at x₁ = ±4
- Steeper slope compared to Ref line
- **Ref Line (dashed orange)**:
- Minimum value ≈ 1 at x₁ = 0
- Peaks ≈ 12.5 at x₁ = ±4
- Shallower slope compared to LPN
#### Right Graph (x₂-axis)
- Identical structure to the left graph, with:
- LPN minimum ≈ 2 at x₂ = 0
- Ref minimum ≈ 1 at x₂ = 0
- Peaks ≈ 13.5 (LPN) and 12.5 (Ref) at x₂ = ±4
### Key Observations
1. **Symmetry**: Both models exhibit perfect symmetry about their respective axes (x₁ and x₂).
2. **Convexity**: Both lines form U-shaped curves, confirming convexity.
3. **Model Differences**:
- LPN predicts steeper slopes and higher peak values.
- Ref predicts shallower slopes and lower peak values.
4. **Minima**: LPN’s minimum is consistently ~1 unit higher than Ref’s across both axes.
### Interpretation
The graphs demonstrate that the LPN model generates convex functions with stronger curvature and higher extremal values compared to the reference model. This suggests LPN may:
- Impose stricter constraints or regularization in optimization problems.
- Be more sensitive to input variations in high-dimensional spaces.
- Produce "sharper" decision boundaries in machine learning applications.
The consistent difference in minima (LPN ≈ 2 vs. Ref ≈ 1) implies LPN might represent a more conservative or pessimistic estimation framework, while Ref could reflect a baseline or less restrictive model. These differences could significantly impact applications like risk modeling, where convexity affects stability and robustness.