\n
## Bar Chart: Subtractor - Time vs Core count
### Overview
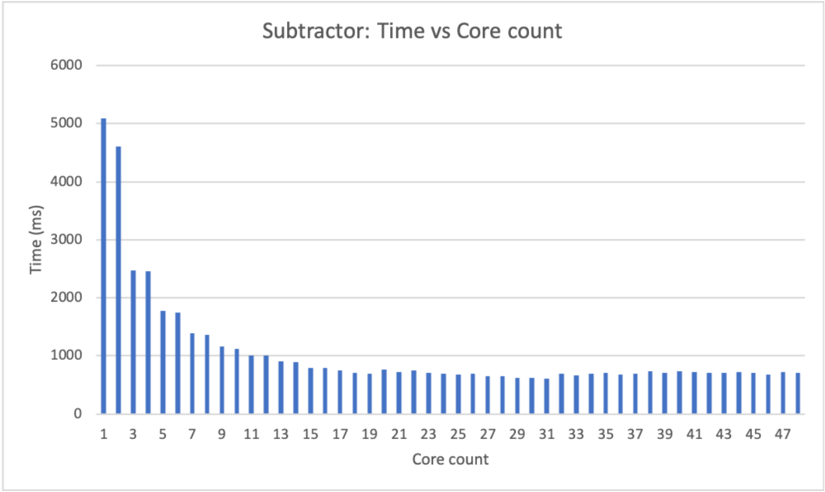
The image presents a bar chart illustrating the relationship between the time taken (in milliseconds) for a "Subtractor" operation and the number of cores used. The chart displays a decreasing trend in execution time as the number of cores increases, with a rapid initial decrease followed by a leveling off.
### Components/Axes
* **Title:** Subtractor: Time vs Core count
* **X-axis:** Core count. Markers are present at integer values from 1 to 47.
* **Y-axis:** Time (ms). Scale ranges from 0 to 6000 milliseconds.
* **Data Series:** A single series of bars representing the time taken for each core count.
* **Bar Color:** Light blue.
### Detailed Analysis
The chart shows a significant decrease in execution time as the core count increases from 1 to approximately 11. Beyond 11 cores, the reduction in execution time becomes much less pronounced, eventually leveling off around 600-800 ms.
Here's a breakdown of approximate values, reading from the chart:
* **1 Core:** ~4900 ms
* **3 Cores:** ~2300 ms
* **5 Cores:** ~1700 ms
* **7 Cores:** ~1300 ms
* **9 Cores:** ~1100 ms
* **11 Cores:** ~900 ms
* **13 Cores:** ~800 ms
* **15 Cores:** ~750 ms
* **17 Cores:** ~700 ms
* **19 Cores:** ~650 ms
* **21 Cores:** ~600 ms
* **23 Cores:** ~580 ms
* **25 Cores:** ~560 ms
* **27 Cores:** ~540 ms
* **29 Cores:** ~530 ms
* **31 Cores:** ~520 ms
* **33 Cores:** ~510 ms
* **35 Cores:** ~500 ms
* **37 Cores:** ~490 ms
* **39 Cores:** ~480 ms
* **41 Cores:** ~470 ms
* **43 Cores:** ~460 ms
* **45 Cores:** ~450 ms
* **47 Cores:** ~440 ms
The trend is a steep decline from 1 to 11 cores, followed by diminishing returns as more cores are added.
### Key Observations
* The most significant performance gains are achieved with a relatively small number of cores (1-11).
* Adding cores beyond 11 yields progressively smaller improvements in execution time.
* The execution time appears to converge towards a minimum value of approximately 440-500 ms as the core count increases.
### Interpretation
The data suggests that the "Subtractor" operation benefits from parallelization, as evidenced by the decreasing execution time with increasing core count. However, the benefits of parallelization diminish beyond a certain point, indicating that the operation may be limited by factors other than the number of available cores (e.g., memory bandwidth, algorithm complexity, or inherent sequential dependencies). The leveling off of the curve suggests that the operation has reached a point where adding more cores does not significantly reduce the time required to complete the task. This could be due to Amdahl's Law, where a portion of the task remains inherently sequential and cannot be parallelized. The initial steep decline indicates a highly parallelizable component of the operation. The chart provides valuable insight into the scalability of the "Subtractor" operation and can inform decisions about resource allocation and optimization strategies.