## Bar Chart: Subtractor: Time vs Core count
### Overview
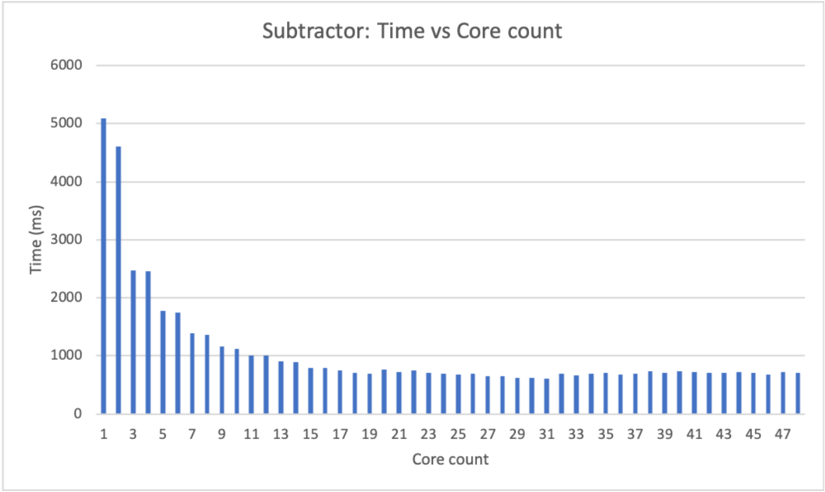
The bar chart displays the time taken by a subtractor in milliseconds (ms) as a function of the core count. The x-axis represents the core count, which ranges from 1 to 47, while the y-axis represents the time taken in milliseconds, ranging from 0 to 6000 ms.
### Components/Axes
- **Title**: Subtractor: Time vs Core count
- **X-axis**: Core count, ranging from 1 to 47
- **Y-axis**: Time (ms), ranging from 0 to 6000 ms
- **Legend**: No legend is present in the image
### Detailed Analysis or ### Content Details
The chart shows a clear trend where the time taken by the subtractor decreases as the core count increases. The highest time taken is approximately 5000 ms at a core count of 1, and the time taken decreases gradually as the core count increases. The time taken at a core count of 47 is approximately 1000 ms.
### Key Observations
- The time taken by the subtractor decreases as the core count increases.
- The highest time taken is at a core count of 1.
- The time taken at a core count of 47 is significantly lower than at a core count of 1.
### Interpretation
The data suggests that the subtractor's performance improves as the number of cores increases. This is because the subtractor can utilize multiple cores to perform the subtraction operation in parallel, reducing the overall time taken. The trend is consistent across the entire range of core counts, indicating that the subtractor is designed to take advantage of multiple cores to improve performance.