## Bar Chart: Subtractor: Time vs Core count
### Overview
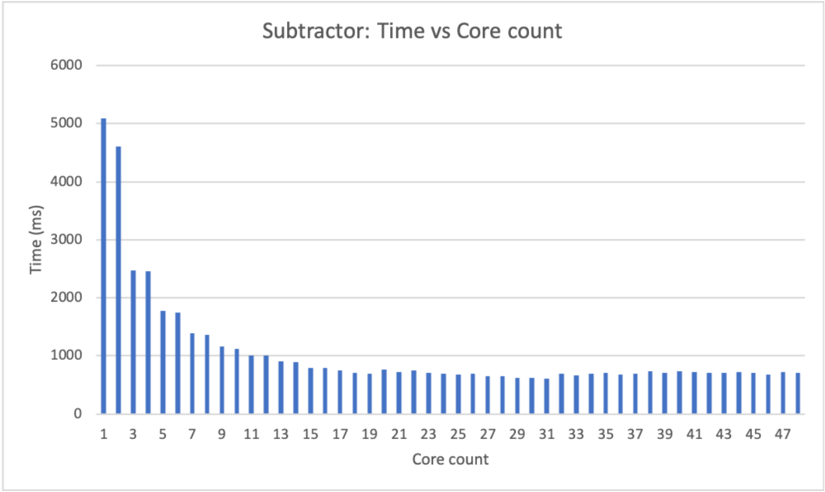
The chart visualizes the relationship between computational core count and execution time (in milliseconds) for a "Subtractor" algorithm. Execution time decreases as core count increases, with a sharp decline at lower core counts followed by a plateau at higher counts.
### Components/Axes
- **Title**: "Subtractor: Time vs Core count"
- **X-axis (Core count)**: Discrete values from 1 to 47, labeled at intervals of 2 (1, 3, 5, ..., 47).
- **Y-axis (Time, ms)**: Continuous scale from 0 to 6000 ms, with gridlines at 1000 ms intervals.
- **Bars**: Blue vertical bars representing execution time for each core count. No explicit legend is present.
### Detailed Analysis
- **Core 1**: Execution time peaks at ~5000 ms.
- **Core 3**: Time drops to ~4500 ms.
- **Cores 5–11**: Gradual decline, with times ranging from ~1800 ms (core 5) to ~1000 ms (core 11).
- **Cores 13–47**: Time stabilizes between ~600 ms and ~700 ms, with minimal variation.
- **Trend**: Execution time decreases non-linearly at lower core counts, then plateaus after ~11 cores.
### Key Observations
1. **Diminishing Returns**: The most significant time reduction occurs between 1 and 11 cores. Beyond this, additional cores yield negligible improvements (~600–700 ms).
2. **Outlier**: Core 1 exhibits the highest execution time (~5000 ms), suggesting single-core inefficiency.
3. **Stability**: Cores 31–47 show consistent performance (~600–700 ms), indicating saturation of parallel processing benefits.
### Interpretation
The data demonstrates that increasing core count improves performance up to a critical threshold (~11 cores), after which further cores provide little benefit. This suggests:
- **Parallelization Limits**: The algorithm may not scale efficiently beyond 11 cores due to overhead (e.g., synchronization, memory contention).
- **Hardware Constraints**: Diminishing returns could reflect physical or architectural limits in core coordination.
- **Optimization Opportunity**: Refactoring the algorithm to better utilize >11 cores might reduce the plateau.
The chart underscores the importance of balancing core count with algorithmic efficiency in high-performance computing.