## Line Chart: Violation rate (Mean Min/Max)
### Overview
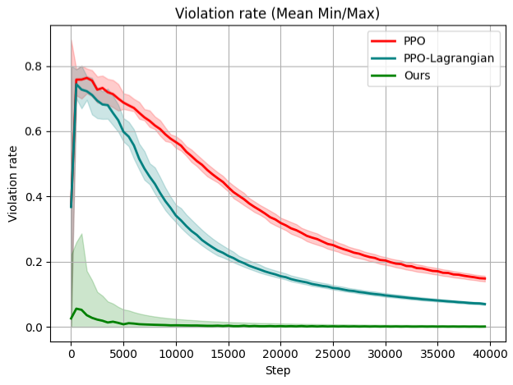
The image is a line chart comparing the violation rates of three different algorithms: PPO, PPO-Lagrangian, and "Ours". The chart displays the mean violation rate along with the min/max range as shaded areas around each line. The x-axis represents the "Step" and the y-axis represents the "Violation rate".
### Components/Axes
* **Title:** Violation rate (Mean Min/Max)
* **X-axis:**
* Label: Step
* Scale: 0 to 40000, with major ticks at 0, 5000, 10000, 15000, 20000, 25000, 30000, 35000, and 40000.
* **Y-axis:**
* Label: Violation rate
* Scale: 0.0 to 0.8, with major ticks at 0.0, 0.2, 0.4, 0.6, and 0.8.
* **Legend:** Located in the top-right corner.
* PPO (Red line with light red shaded area)
* PPO-Lagrangian (Teal line with light teal shaded area)
* Ours (Green line with light green shaded area)
### Detailed Analysis
* **PPO (Red):**
* Trend: Initially increases sharply, then decreases gradually.
* Data Points: Starts around 0.0, rises to approximately 0.77 around step 2500, and then decreases to approximately 0.18 at step 40000.
* Min/Max Range: The shaded area around the red line indicates the minimum and maximum violation rates for PPO at each step. The range is wider at the beginning and narrows as the step increases.
* **PPO-Lagrangian (Teal):**
* Trend: Initially increases sharply, then decreases gradually.
* Data Points: Starts around 0.0, rises to approximately 0.73 around step 2500, and then decreases to approximately 0.07 at step 40000.
* Min/Max Range: The shaded area around the teal line indicates the minimum and maximum violation rates for PPO-Lagrangian at each step. The range is wider at the beginning and narrows as the step increases.
* **Ours (Green):**
* Trend: Remains relatively constant at a low violation rate.
* Data Points: Starts around 0.04 and remains close to 0.0 for the entire range of steps.
* Min/Max Range: The shaded area around the green line indicates the minimum and maximum violation rates for "Ours" at each step. The range is narrow, indicating low variability.
### Key Observations
* PPO and PPO-Lagrangian exhibit similar trends, with a sharp initial increase in violation rate followed by a gradual decrease.
* The "Ours" algorithm consistently maintains a very low violation rate throughout the entire range of steps.
* The min/max ranges for PPO and PPO-Lagrangian are wider at the beginning, indicating higher variability in the initial steps.
* The "Ours" algorithm has a much narrower min/max range, indicating more consistent performance.
### Interpretation
The chart suggests that the "Ours" algorithm is significantly more effective at minimizing violation rates compared to PPO and PPO-Lagrangian. While PPO and PPO-Lagrangian initially perform poorly, their violation rates decrease over time, suggesting some learning or adaptation. However, they never reach the consistently low violation rate achieved by the "Ours" algorithm. The min/max ranges indicate that the performance of PPO and PPO-Lagrangian is more variable, especially in the early stages, while the "Ours" algorithm provides more stable and reliable performance. The data demonstrates the superior performance of the "Ours" algorithm in terms of minimizing violation rates.