## Line Chart with Confidence Intervals: Violation rate (Mean Min/Max)
### Overview
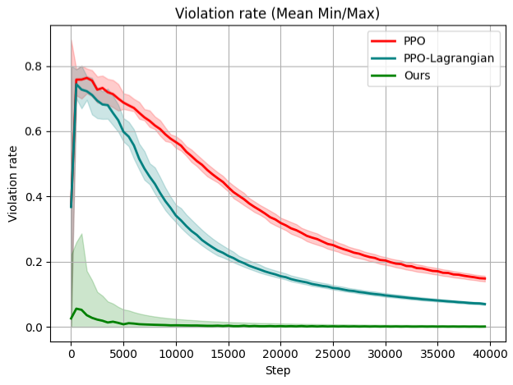
The image is a line chart titled "Violation rate (Mean Min/Max)" that compares the performance of three different algorithms or methods over the course of training steps. The chart plots the "Violation rate" on the y-axis against the number of "Step"s on the x-axis. Each method is represented by a solid line (the mean) and a shaded region around it (representing the min/max range or confidence interval).
### Components/Axes
* **Chart Title:** "Violation rate (Mean Min/Max)" (Top center).
* **Y-Axis:**
* **Label:** "Violation rate" (Vertical, left side).
* **Scale:** Linear scale from 0.0 to 0.8, with major tick marks at 0.0, 0.2, 0.4, 0.6, and 0.8.
* **X-Axis:**
* **Label:** "Step" (Horizontal, bottom).
* **Scale:** Linear scale from 0 to 40,000, with major tick marks at 0, 5000, 10000, 15000, 20000, 25000, 30000, 35000, and 40000.
* **Legend:** Located in the top-right corner of the plot area. It contains three entries:
1. **PPO:** Represented by a red line.
2. **PPO-Lagrangian:** Represented by a teal/blue-green line.
3. **Ours:** Represented by a green line.
* **Data Series:** Three distinct lines with associated shaded confidence bands.
* **PPO (Red Line):** Starts high, peaks early, then shows a steady, gradual decline.
* **PPO-Lagrangian (Teal Line):** Starts lower than PPO, peaks slightly later, then declines more steeply than PPO before flattening out.
* **Ours (Green Line):** Starts very low, has a minor early peak, and remains near zero for the vast majority of steps.
### Detailed Analysis
**Trend Verification & Data Point Extraction (Approximate Values):**
1. **PPO (Red Line):**
* **Trend:** Sharp initial increase to a peak, followed by a consistent, monotonic decrease over the remaining steps. The slope of decline is moderate and relatively constant after step ~5,000.
* **Key Points:**
* Step 0: ~0.4
* Peak (~Step 1,000): Mean ≈ 0.75, with a max (top of red shading) near 0.85.
* Step 10,000: Mean ≈ 0.6
* Step 20,000: Mean ≈ 0.35
* Step 30,000: Mean ≈ 0.2
* Step 40,000: Mean ≈ 0.15
2. **PPO-Lagrangian (Teal Line):**
* **Trend:** Sharp initial increase to a peak (lower and slightly later than PPO), followed by a steeper decline than PPO until approximately step 20,000, after which the rate of decline slows significantly.
* **Key Points:**
* Step 0: ~0.4
* Peak (~Step 2,000): Mean ≈ 0.7, with a max (top of teal shading) near 0.8.
* Step 10,000: Mean ≈ 0.4
* Step 20,000: Mean ≈ 0.15
* Step 30,000: Mean ≈ 0.1
* Step 40,000: Mean ≈ 0.08
3. **Ours (Green Line):**
* **Trend:** Very low initial value, a small, brief increase to a low peak, followed by a rapid decline to near-zero levels by step ~5,000. It maintains a near-zero violation rate for the remainder of the training steps, showing minimal variance (very narrow green shading).
* **Key Points:**
* Step 0: ~0.02
* Peak (~Step 1,000): Mean ≈ 0.05, with a max (top of green shading) near 0.3.
* Step 5,000: Mean ≈ 0.01
* Step 10,000 to 40,000: Mean remains consistently near 0.0 (approximately 0.0 to 0.02).
### Key Observations
1. **Performance Hierarchy:** The method labeled "Ours" demonstrates a significantly lower violation rate throughout nearly the entire training process compared to both PPO and PPO-Lagrangian.
2. **Convergence Speed:** "Ours" converges to a near-zero violation rate extremely quickly (within ~5,000 steps). PPO-Lagrangian converges to a low rate (~0.1) by step 30,000, while PPO still has a notably higher rate (~0.2) at that point.
3. **Variance/Uncertainty:** The shaded regions indicate the min/max range. PPO and PPO-Lagrangian show substantial variance, especially during the initial peak phase (steps 0-5,000). The variance for "Ours" is also notable during its early peak but becomes negligible once the rate drops near zero.
4. **Initial Conditions:** All three methods start at a similar violation rate (~0.4) at step 0, but their trajectories diverge immediately.
### Interpretation
This chart likely comes from a reinforcement learning or optimization study where the goal is to minimize a constraint violation (the "Violation rate"). The data suggests the following:
* **Superiority of the Proposed Method:** The method "Ours" is presented as a novel approach that achieves the primary objective (minimizing violations) far more effectively and efficiently than the baseline methods (PPO and PPO-Lagrangian). It not only reaches a lower final violation rate but does so orders of magnitude faster.
* **Trade-off Between Methods:** PPO-Lagrangian, which likely incorporates a Lagrangian multiplier to handle constraints, shows a clear improvement over standard PPO in both final performance and convergence speed. However, it is still substantially outperformed by "Ours."
* **Stability:** The very narrow confidence band for "Ours" after step 5,000 indicates high stability and reliability in maintaining near-zero violations once converged, unlike the other methods which continue to exhibit higher mean rates and variance.
* **Underlying Mechanism:** The dramatic difference in performance implies that the core algorithmic innovation in "Ours" addresses the constraint satisfaction problem in a fundamentally more effective way, possibly through a different formulation of the objective, a more efficient policy update rule, or a better mechanism for balancing reward maximization with constraint adherence. The chart serves as strong empirical evidence for the claimed advantage of the new method.