## Line Graph: Violation Rate (Mean Min/Max)
### Overview
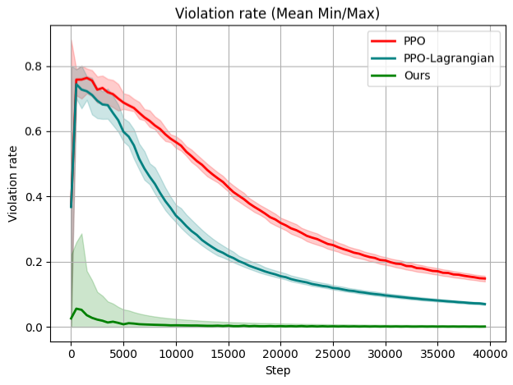
The graph compares the violation rate trends of three methods—PPO, PPO-Lagrangian, and "Ours"—over 40,000 optimization steps. Violation rates are plotted on the y-axis (0–0.8), while the x-axis represents incremental steps. Shaded regions around each line indicate variability (likely confidence intervals or error margins).
### Components/Axes
- **Title**: "Violation rate (Mean Min/Max)"
- **X-axis**: "Step" (0 to 40,000, linear scale)
- **Y-axis**: "Violation rate" (0 to 0.8, linear scale)
- **Legend**: Top-right corner, mapping colors to methods:
- Red: PPO
- Teal: PPO-Lagrangian
- Green: Ours
### Detailed Analysis
1. **PPO (Red Line)**:
- Starts at ~0.8 violation rate at step 0.
- Declines sharply to ~0.15 by step 40,000.
- Shaded region widens initially, narrowing as steps increase.
2. **PPO-Lagrangian (Teal Line)**:
- Begins slightly below PPO (~0.75 at step 0).
- Drops more steeply than PPO, reaching ~0.05 by step 40,000.
- Shaded region remains narrower than PPO’s throughout.
3. **"Ours" (Green Line)**:
- Starts near 0 violation rate at step 0.
- Remains flat at ~0.01–0.02 for all steps.
- Minimal shaded region, indicating low variability.
### Key Observations
- All methods show decreasing violation rates over time, but "Ours" achieves the lowest and most stable rate.
- PPO and PPO-Lagrangian exhibit overlapping confidence intervals in early steps (0–5,000), diverging afterward.
- "Ours" demonstrates near-zero violation rates by step 5,000, with no significant change thereafter.
### Interpretation
The data suggests that the method labeled "Ours" outperforms PPO and PPO-Lagrangian in minimizing violation rates, likely due to superior optimization or constraint-handling mechanisms. The shaded regions highlight that PPO and PPO-Lagrangian have higher uncertainty in early steps, while "Ours" maintains consistent performance. The flat trajectory of "Ours" implies rapid convergence to an optimal solution, making it the most reliable method for this task.